Expert Advisor Builder
Manual do usuário detalhado
Início rápido
INFO
Este guia de início rápido leva apenas 25 a 30 minutos para ser seguido.
Versão em vídeo:
Princípio de funcionamento
O Expert Advisor Builder representa uma abordagem revolucionária ao trading algorítmico nas plataformas MetaTrader 4 e MetaTrader 5. Em sua essência, esse sofisticado ambiente de execução transforma suas ideias de trading em estratégias automatizadas sem exigir nenhum conhecimento de programação.
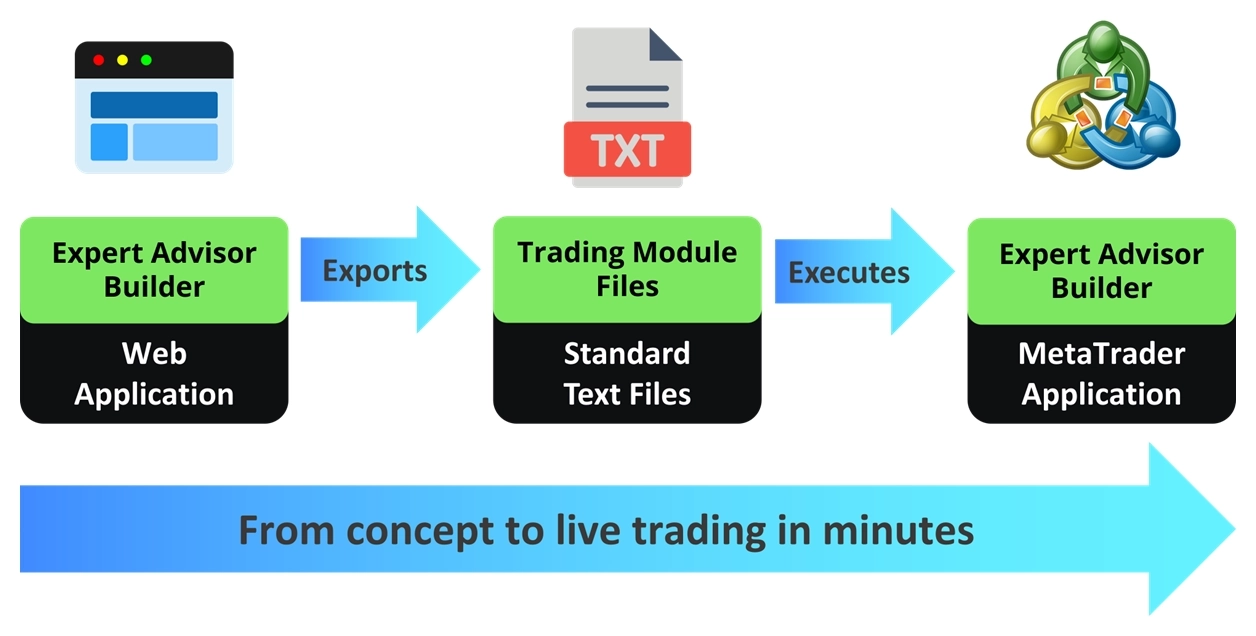
Todo o fluxo de trabalho consiste em três componentes simples que funcionam em perfeita harmonia:
- Expert Advisor Builder (Aplicativo Web): Acesse nosso aplicativo web intuitivo diretamente pelo navegador. Aqui você criará sua lógica de trading usando uma interface visual. Cada módulo de trading que você criar representa uma estratégia completa e independente.
- Módulos de Trading (Arquivos de Texto): Suas estratégias são exportadas como arquivos de texto simples contendo todos os parâmetros e a lógica necessários para a execução. Esses módulos são completamente transparentes: todos os aspectos da sua estratégia ficam visíveis e editáveis. Sem componentes ocultos nem algoritmos do tipo caixa-preta.
- Expert Advisor Builder (Runtime do MetaTrader): Este poderoso aplicativo é executado dentro do MetaTrader, lendo seus módulos de trading e executando operações conforme a lógica que você definiu. Ele se integra perfeitamente ao MT4 e ao MT5, oferecendo capacidades de execução de nível profissional. Os módulos podem ser adicionados, removidos ou modificados dinamicamente em tempo de execução.
A beleza desse sistema está em sua simplicidade e transparência. Você pode criar estratégias complexas com múltiplos timeframes, implementar gestão de risco sofisticada e utilizar indicadores técnicos avançados, tudo por meio de uma interface visual intuitiva. Cada módulo opera de forma independente, permitindo executar várias estratégias simultaneamente sem interferências.
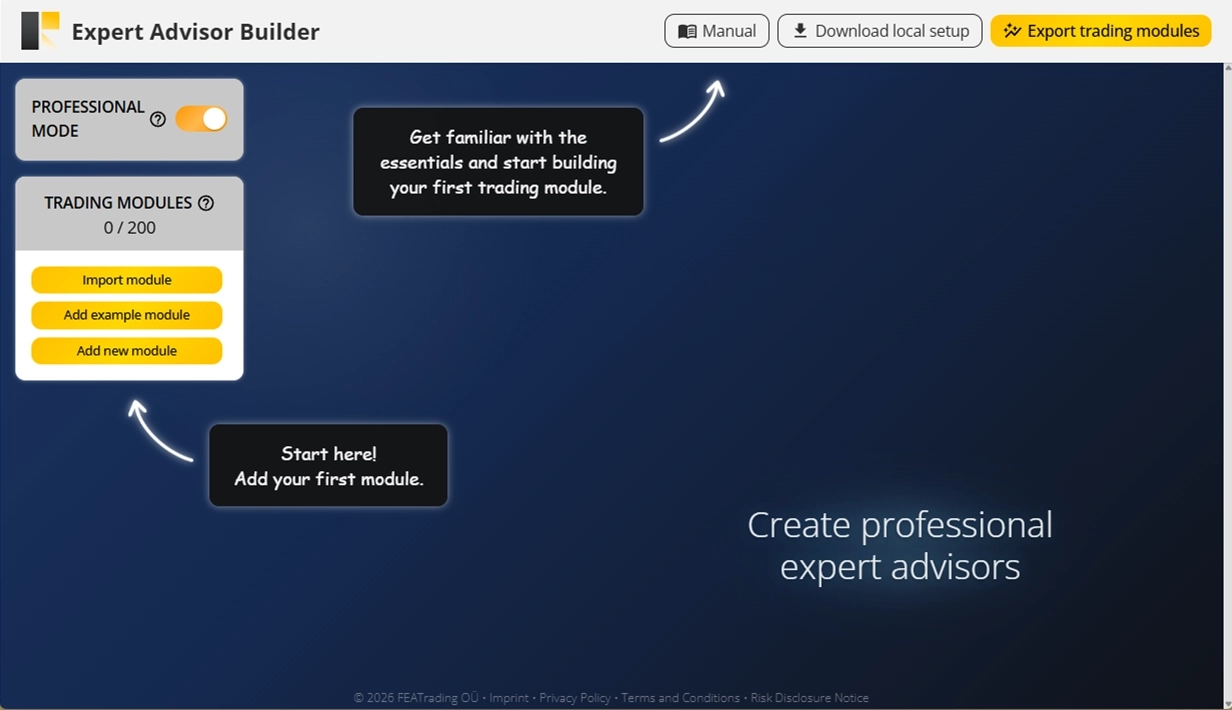
Visite nossa aplicação web Expert Advisor Builder e comece a criar imediatamente.
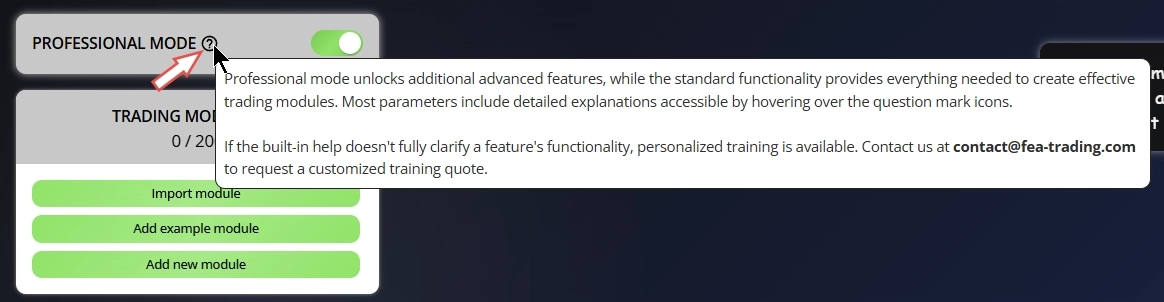
TIP
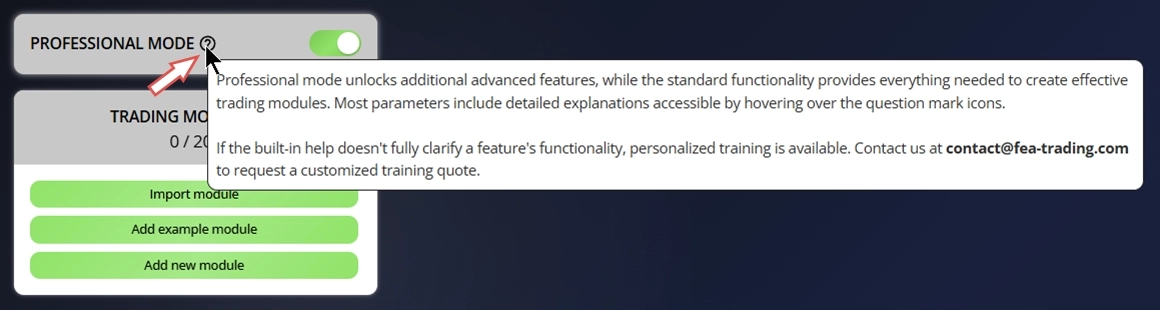
O Expert Advisor Builder inclui ajuda integrada. Passe o cursor sobre qualquer ícone de ponto de interrogação para ver detalhes sobre uma configuração específica.
Instalação
O instalador configura automaticamente a extensão MetaTrader do Expert Advisor Builder necessária para o funcionamento perfeito.
Passo 1: Baixe o instalador
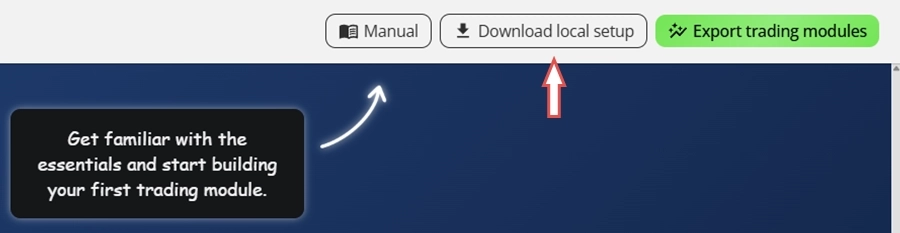
Você pode baixar a extensão MetaTrader do Expert Advisor Builder aqui ou clicar em Download local setup no canto superior direito do aplicativo web. O download é entregue como um único arquivo ZIP que instala tanto no MetaTrader 4 quanto no MetaTrader 5.
Passo 2: Execute a instalação
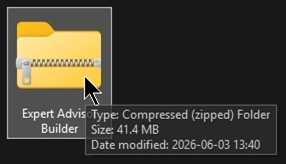
Quando o download for concluído, você terá um arquivo ZIP chamado Expert Advisor Builder. Localize-o na sua pasta de downloads e abra-o para visualizar o conteúdo.
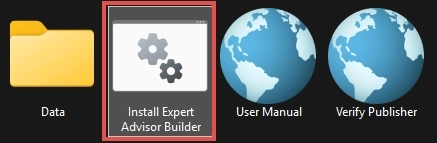
Dentro do arquivo, execute o script Install Expert Advisor Builder para iniciar a instalação.
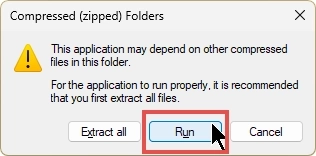
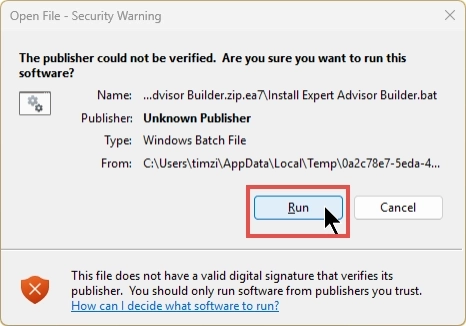
Ao iniciar o instalador diretamente pelo ZIP, o Windows exibe um aviso de Pastas Compactadas (Zipadas). Basta clicar em Executar para continuar, conforme mostrado abaixo. Como alternativa, você pode extrair todos os arquivos previamente e depois iniciar o Install Expert Advisor Builder a partir da pasta extraída. Observe que essa etapa pode ter uma aparência ligeiramente diferente se você abrir o arquivo com uma ferramenta de terceiros, como WinZip ou WinRAR.
Como o script instalador não é assinado digitalmente, o Windows exibe um aviso de Segurança para Abertura de Arquivo indicando o editor como Editor Desconhecido. Isso é esperado, então clique em Executar para prosseguir. Se quiser verificar o arquivo com antecedência, use o atalho Verify Publisher incluído no arquivo.
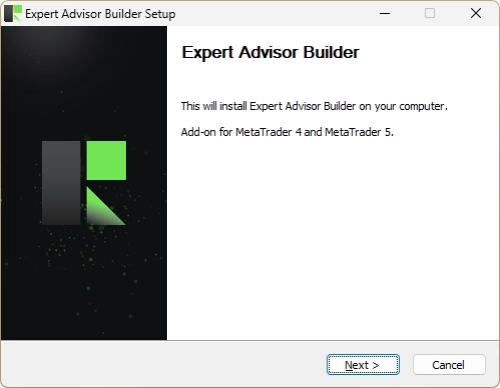
O assistente de Configuração do Expert Advisor Builder abre em seguida e instala o complemento para o MetaTrader 4 e o MetaTrader 5. Clique em Avançar e siga as etapas na tela para concluir a instalação.
INFO
A configuração instala o Expert Advisor Builder em todas as instalações do MetaTrader 4 e MetaTrader 5 encontradas no seu computador. Se você adicionar outro MetaTrader posteriormente, basta executar a instalação novamente para adicionar o Expert Advisor Builder a essa nova instância.
Você não precisa atualizar o Expert Advisor Builder manualmente. Sempre que uma nova versão fica disponível, o Expert Advisor Builder notifica você diretamente na interface do usuário e pede seu consentimento antes de instalá-la. Nada é atualizado em segundo plano sem o seu consentimento. Quando você aceita, o Expert Advisor Builder aplica a atualização e recarrega de forma limpa para que a nova versão entre em vigor. Você também pode recusar por enquanto e continuar usando a versão atual; o Expert Advisor Builder perguntará novamente na próxima vez.
Passo 3: Configure as definições do MetaTrader
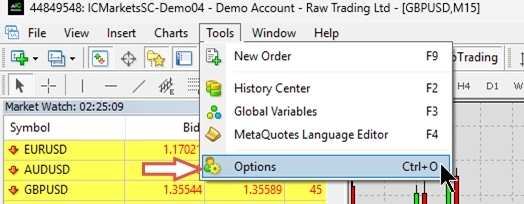
Como o Expert Advisor Builder interage com um servidor back-end, você precisa ajustar algumas configurações no MetaTrader. Abra a instância do MetaTrader escolhida durante a instalação e acesse o menu Opções.
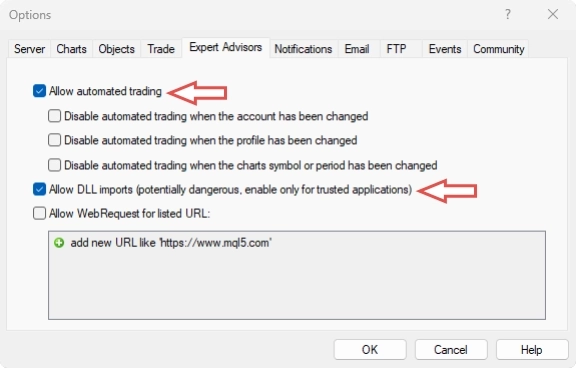
Vá para a aba Expert Advisors e ative Permitir trading automatizado e Permitir importações de DLL. O aplicativo depende de bibliotecas nativas do Windows para se conectar a um servidor de notícias de back-end e fornecer dados de notícias em tempo real aos seus sistemas de trading.
Seu MetaTrader está agora pronto para executar estratégias de trading sofisticadas criadas com o Expert Advisor Builder.
Crie seu primeiro módulo de trading
INFO
Primeiro módulo: MACD Long trading
Vamos criar seu primeiro módulo de trading usando o aplicativo web Expert Advisor Builder. Começaremos com uma configuração manual.
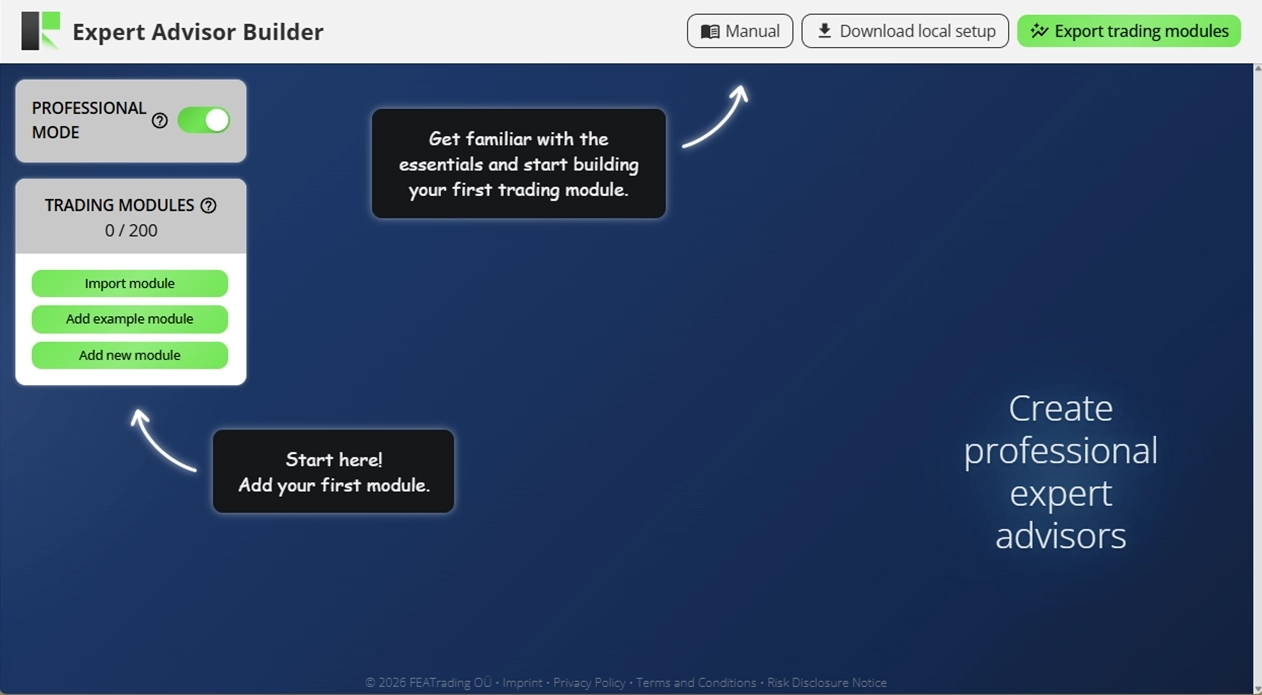
Passo 1: Abra o aplicativo web Expert Advisor Builder
Não é necessário fazer login e seu progresso mais recente é salvo automaticamente. Quando você reabrir o aplicativo, seu trabalho será restaurado, portanto recarregar ou fechar o aplicativo web não apagará nada.
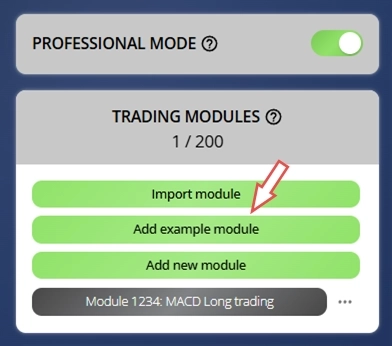
Passo 2: Adicione um novo módulo
Clique em Add new module para criar um módulo de trading em branco. O Expert Advisor Builder segue o princípio de que um módulo de trading em branco já vem pré-configurado com valores padrão ideais para cada componente. Isso significa que você só precisa ajustar as configurações diferenciais, em vez de construir tudo do zero. O resultado: máximo rendimento com o mínimo de esforço.
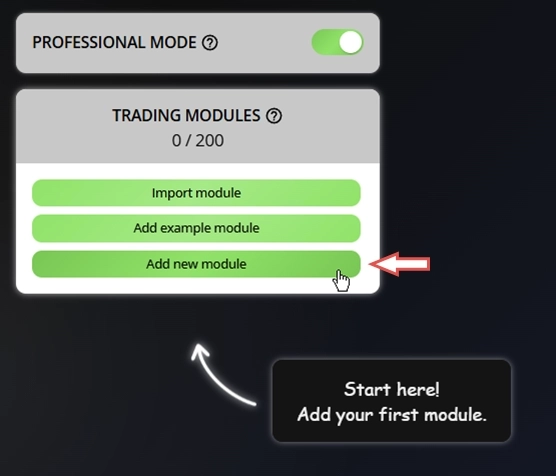
Você verá algumas dicas úteis já na tela, apontando para os próximos passos.
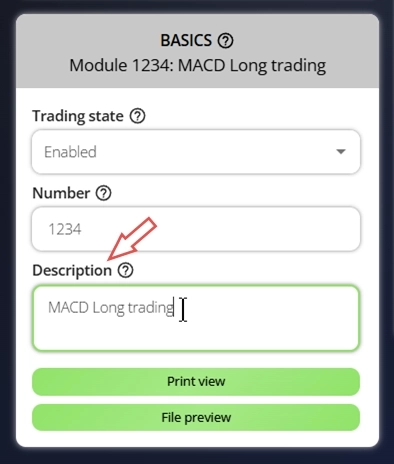
Passo 3: Configure os fundamentos do módulo
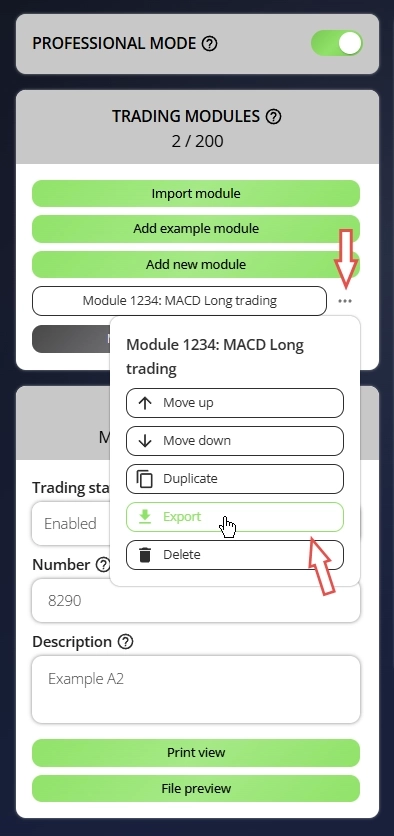
Abaixo do módulo recém-adicionado, uma janela de configuração será exibida. Use-a para definir os seguintes parâmetros:
- Trading state = Enabled
- Number = 1234
- Description = MACD Long trading
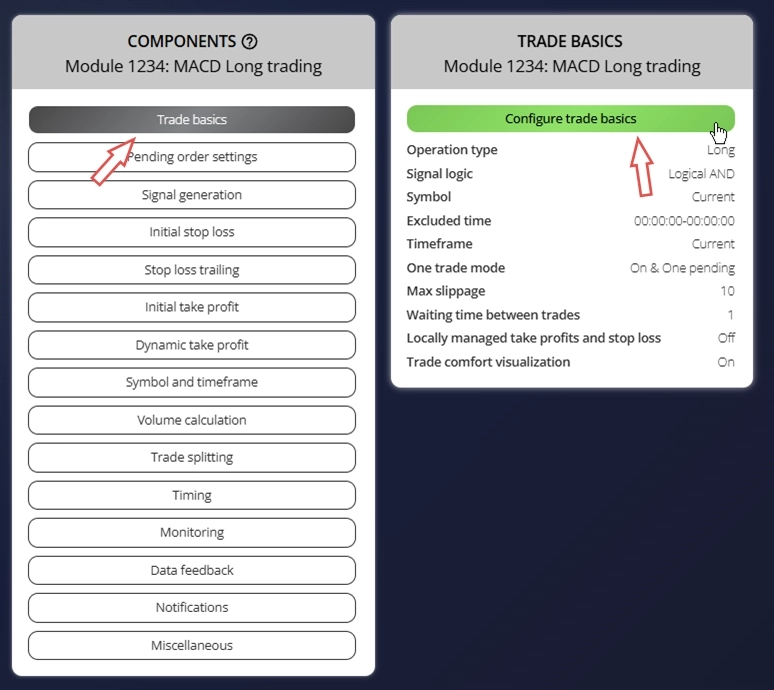
Passo 4: Configure os fundamentos da operação
Acesse o componente Trade Basics para ver suas configurações atuais. Você encontrará um resumo de todos os valores configurados exibidos nessa seção. O menu de configuração fica no topo, logo acima da visão geral de parâmetros. Cada componente do Expert Advisor Builder usa esse mesmo layout: um menu de configurações acima e uma exibição de parâmetros abaixo. Para modificar essas configurações, clique em Configure trade basics para abrir a janela de entrada.
Certifique-se de que o seguinte parâmetro esteja configurado corretamente, pressione Save e Close o diálogo:
- Operation type = Long
Passo 5: Adicione um indicador de desvio padrão
Para definir o nível do Stop Loss, usaremos o valor do oscilador de desvio padrão. Primeiro, precisamos adicionar e configurar um indicador para que seu valor possa ser usado por outros componentes. Vá à seção Signal Generation e escolha Indicators.
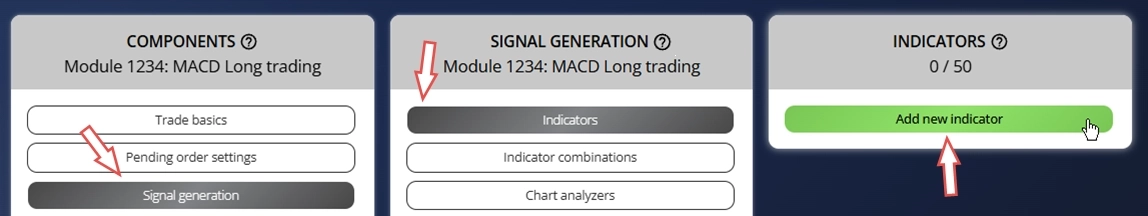
Clique no botão Add new indicator. Isso cria um novo indicador e abre imediatamente seu menu de configuração. Altere o seguinte parâmetro, pressione Save e Close o diálogo:
- Signal in use = On
- Signal used for = Forward
- Selected indicator = STD
- Draw in chart = Off
- Forward adjustment = 3.50
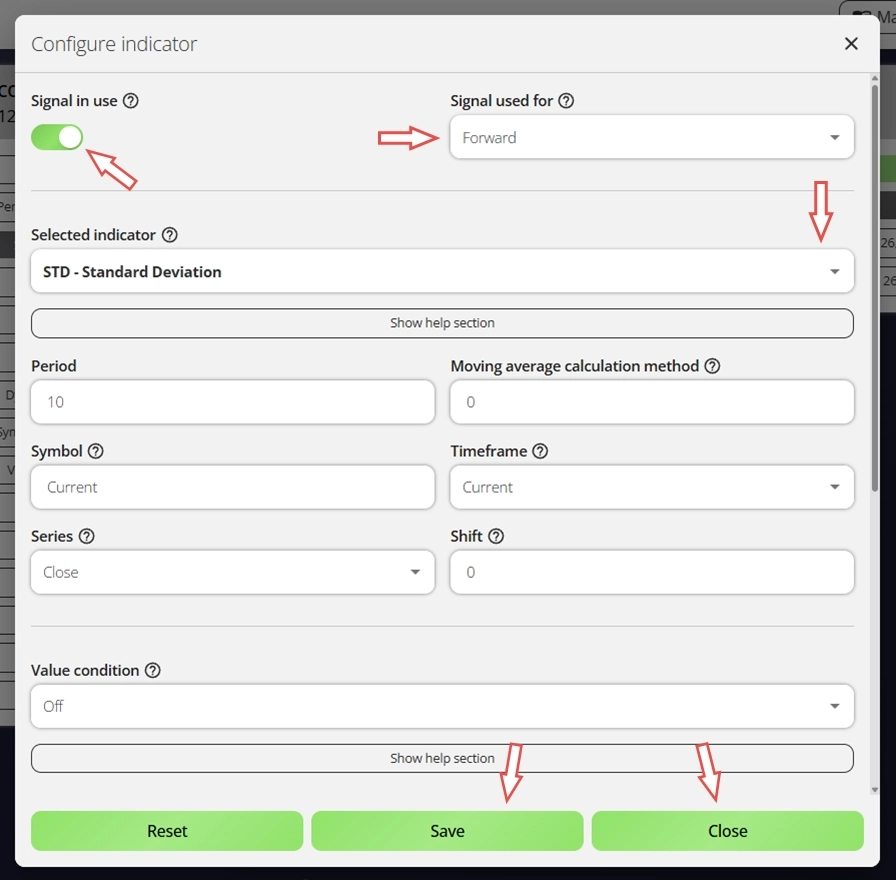
Este indicador serve apenas a um propósito: definir o Stop Loss inicial. Ele não participará da geração de sinais de operação nem influenciará quando as operações serão abertas ou fechadas. Precisaremos deste indicador mais adiante.
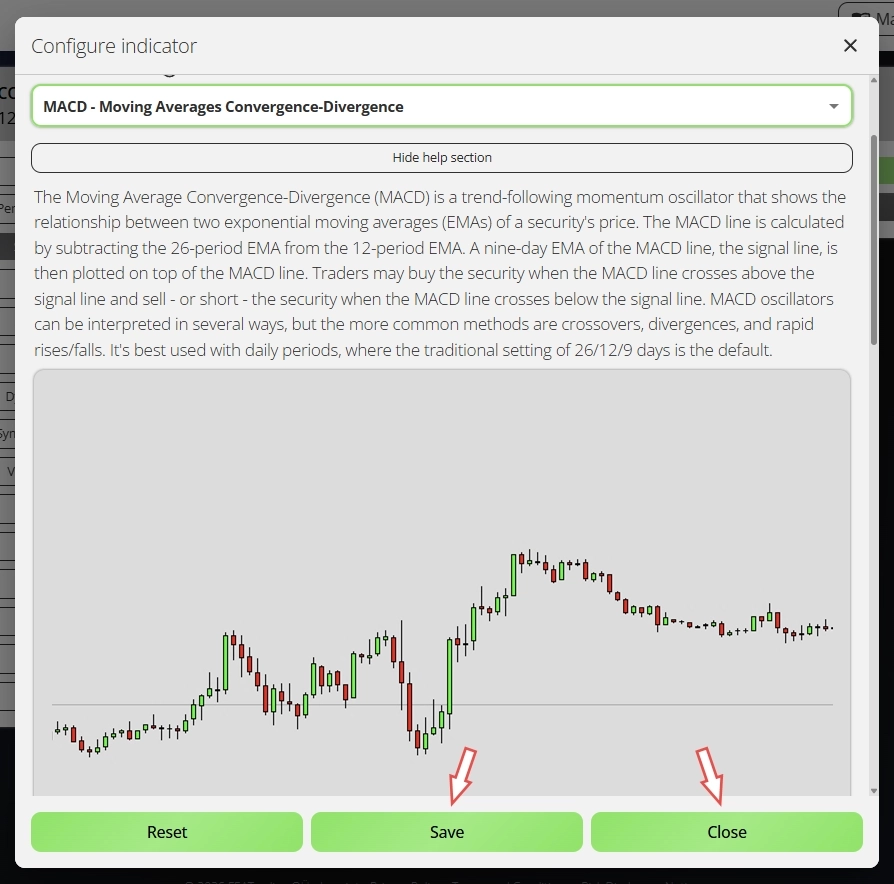
Passo 6: Configure o sinal MACD
Um módulo de trading precisa identificar quando entrar no mercado. Usaremos o oscilador MACD com suas duas linhas padrão para gerar sinais de trading. Adicione outro indicador clicando em Add new indicator mais uma vez. Em seguida, ajuste esses parâmetros, pressione Save e Close o diálogo:
- Signal in use = On
- Signal used for = Entry
- Selected indicator = MACD
- Line index = Main line
- Draw in chart = On
- Drawing slot = 1
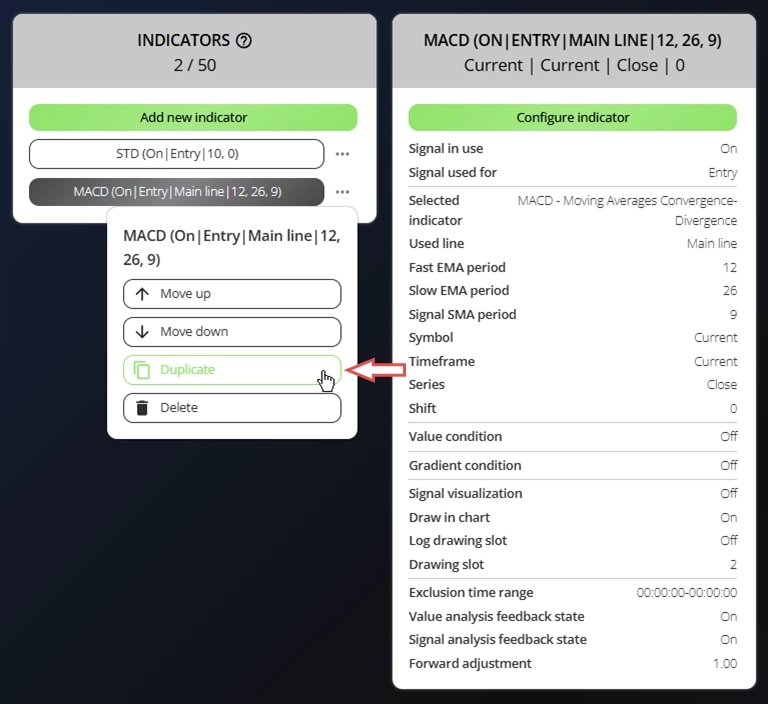
Observe que configuramos apenas a linha principal do MACD. Cada componente de indicador lida com apenas uma linha por vez. Para incluir a linha de Signal do MACD, precisamos de outro componente de indicador. Como ambos usam o mesmo sistema MACD, você pode simplesmente copiar o existente. Clique nos três pontos ao lado do indicador MACD atual e escolha Duplicate. Isso cria uma cópia exata com configurações idênticas. Agora você só precisa alterar o parâmetro Used line para Signal line. Certifique-se de que o novo indicador tenha essas configurações, pressione Save e Close o diálogo:
- Signal in use = On
- Signal used for = Entry
- Selected indicator = MACD
- Line index = Signal line
- Draw in chart = On
- Drawing slot = 2
Agora vamos conectar as duas linhas do MACD que configuramos. Navegue até o componente Indicator Combinations, localizado diretamente abaixo do componente Indicators que você acabou de usar.
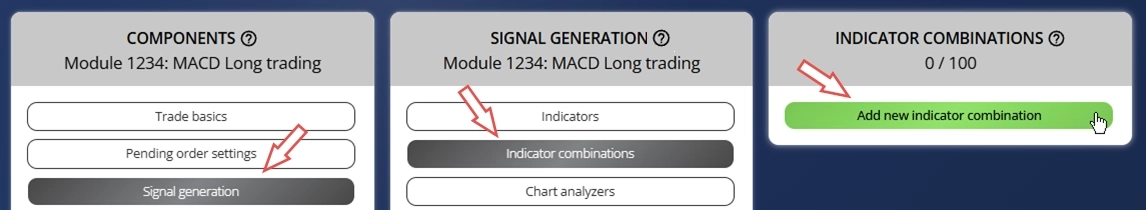
Clique em Add new indicator combination para criar uma relação entre as duas linhas do indicador. Isso abre outra janela de configuração. Defina as seguintes opções, pressione Save e Close o diálogo:
- Signal in use = On
- Signal used for = Entry
- Input indicator 1 = MACD (Main line)
- Input indicator 2 = MACD (Signal line)
- Value relation = Value 1 cross value 2
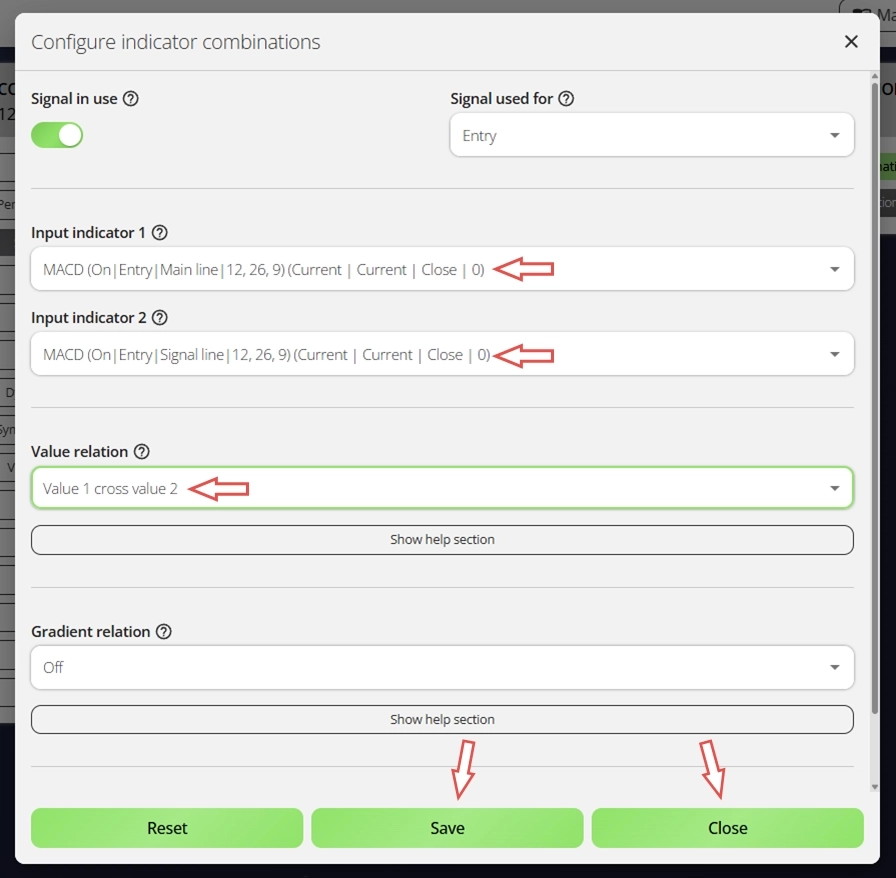
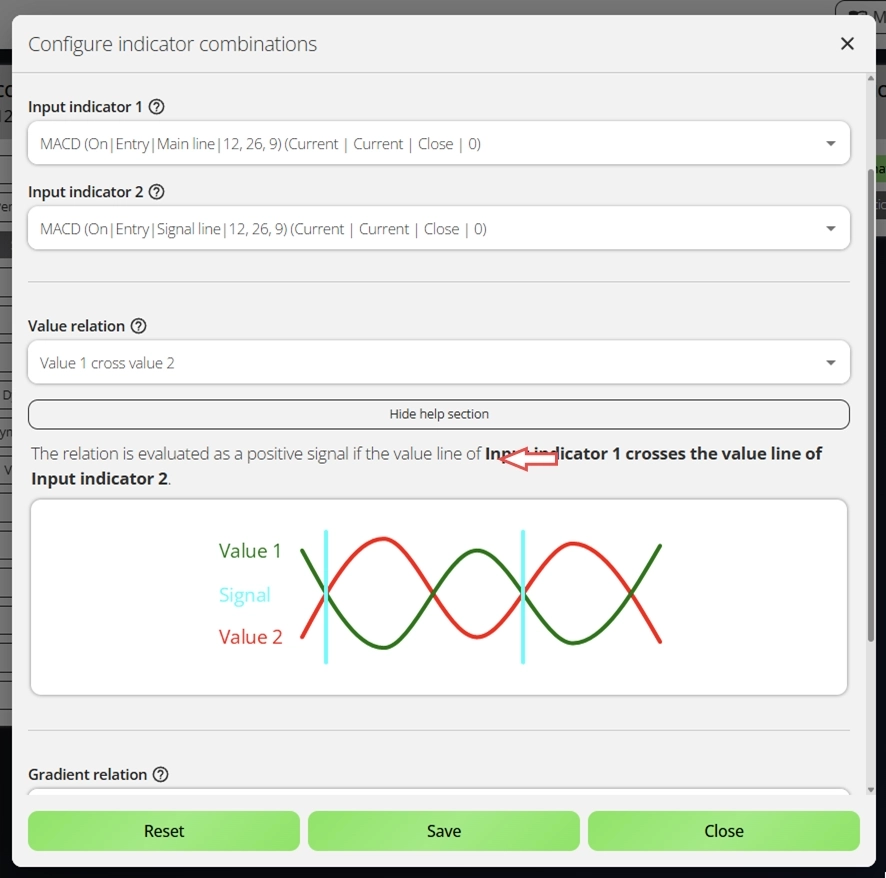
Alguns parâmetros incluem seções de ajuda que fornecem detalhes adicionais sobre recursos específicos. Você pode expandir essas seções para saber mais sobre cada configuração. Veja a imagem abaixo para entender, por exemplo, o que Value 1 cross value 2 realmente significa.
Excelente trabalho! Você criou seu primeiro sinal de trading usando o oscilador MACD e ambas as suas linhas. Como você pode ver, o sistema suporta até 50 indicadores e múltiplas combinações de indicadores, dando a você a flexibilidade para construir qualquer tipo de estratégia de trading. Além dos indicadores, você também pode gerar sinais a partir de um analisador de gráficos avançado, eventos de notícias, scanner de padrões de velas, detector de padrões de gráficos e localizador de padrões de Fibonacci. Essas ferramentas oferecem possibilidades quase ilimitadas para a criação de estratégias.
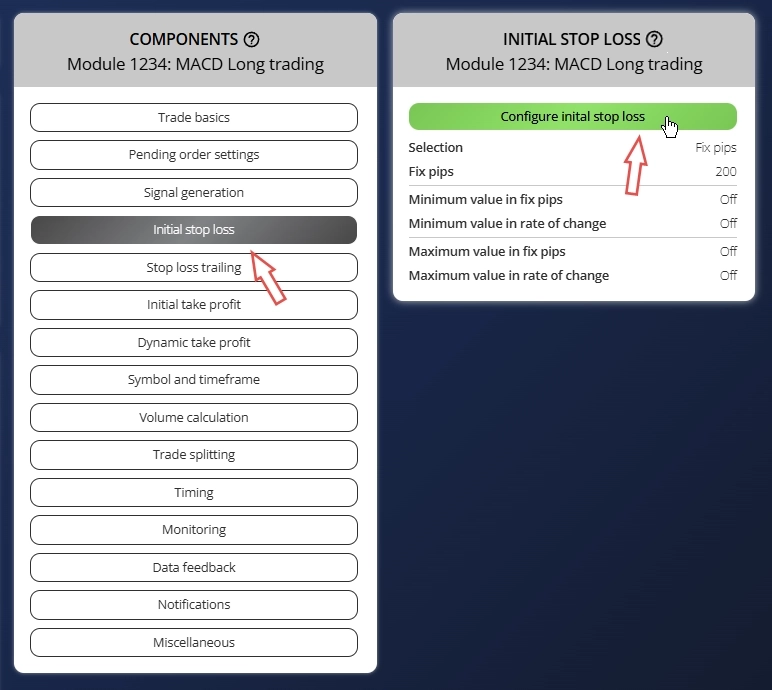
Passo 7: Configure o Stop Loss inicial
Lembra do indicador de desvio padrão (STD) que criamos anteriormente com Signal used for = Forward? Agora vamos utilizá-lo. Selecione o componente Initial Stop Loss e clique em Configure initial stop loss para abrir o menu de configurações.
Certifique-se de que esses parâmetros estejam definidos e pressione Save e Close o diálogo:
- Selection = Indicator
- Used indicator = STD
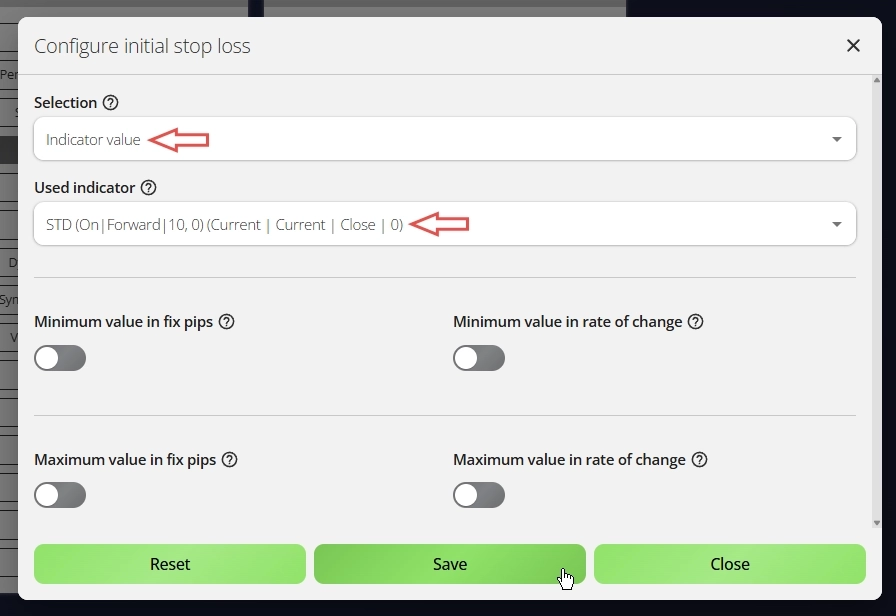
Você verá que apenas os indicadores definidos com Signal used for = Forward aparecem na lista de seleção. Isso significa que o valor calculado pelo indicador é repassado para uso em outros componentes. Para modificar esse valor, use o parâmetro Forward adjustment. Neste caso, um Forward adjustment maior posiciona o Stop Loss inicial mais distante do preço de entrada.
Passo 8: Configure o Take Profit inicial
Por fim, vamos definir o nível de Take Profit inicial para este módulo de trading. Abra o componente Initial Take Profit e clique em Configure initial take profit.
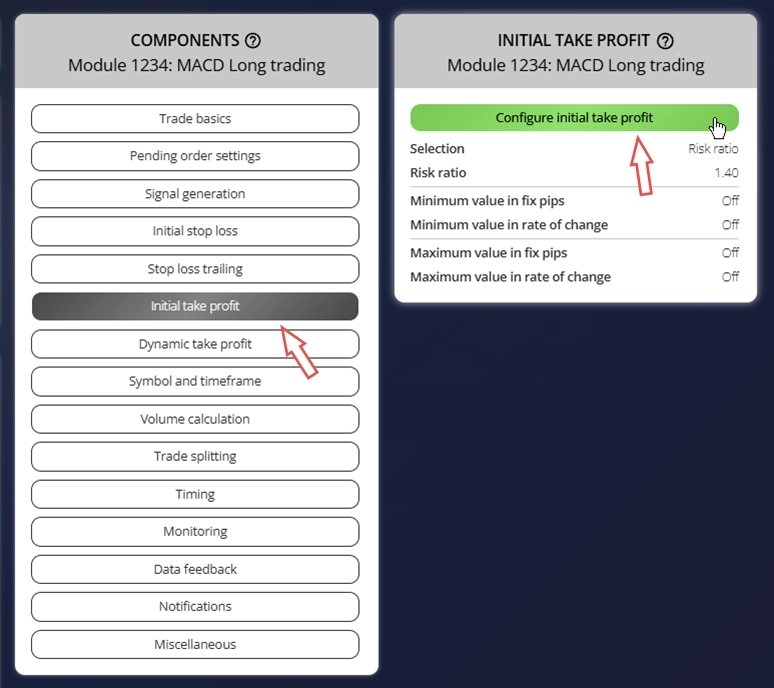
Certifique-se de que esses parâmetros estejam configurados, pressione Save e Close o diálogo:
- Selection = Risk ratio
- Used indicator = 1.40

O sistema usa um risk ratio de 1,40 para o nível de Take Profit, o que significa que o alvo de lucro potencial é 40% maior do que o risco assumido. Isso cria um equilíbrio favorável de risco/recompensa para a lucratividade a longo prazo.
Adicione um módulo de exemplo
INFO
Segundo módulo: MACD Short trading
Para o segundo módulo, usaremos o recurso de importação de exemplos para agilizar o processo. O Expert Advisor Builder inclui uma ampla variedade de exemplos úteis, cada um acompanhado de uma explicação detalhada e um guia passo a passo. Alguns exemplos são projetados para ajudar você a entender configurações básicas, enquanto outros servem como pontos de partida sólidos para desenvolver uma estratégia de trading robusta.
Passo 1: Abra o menu de Exemplos
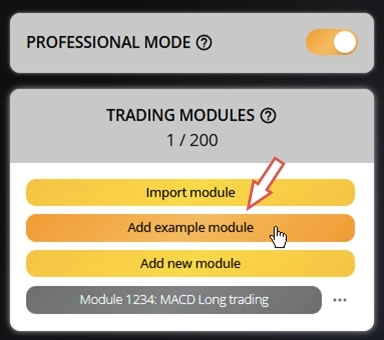
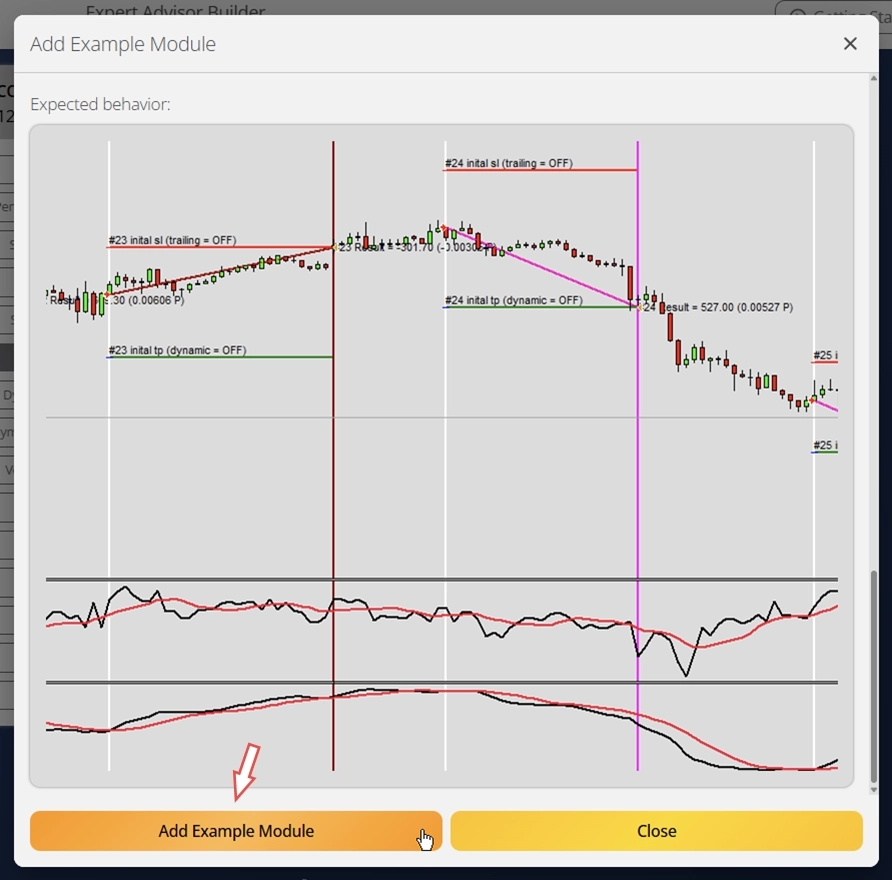
No lado esquerdo da janela principal, clique em Add example module. Isso abre um diálogo exibindo uma lista de módulos de exemplo pré-criados. Cada exemplo inclui uma breve descrição, seus parâmetros de configuração e uma imagem de gráfico de amostra mostrando o resultado esperado. Reserve um tempo para explorar cada exemplo com atenção.
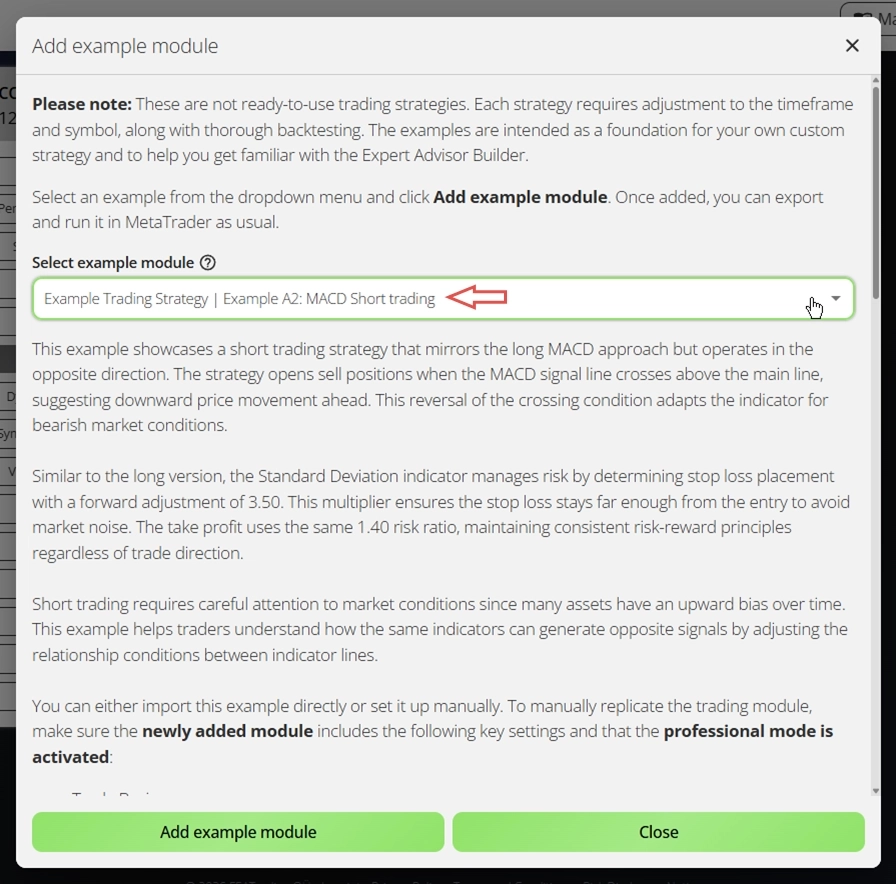
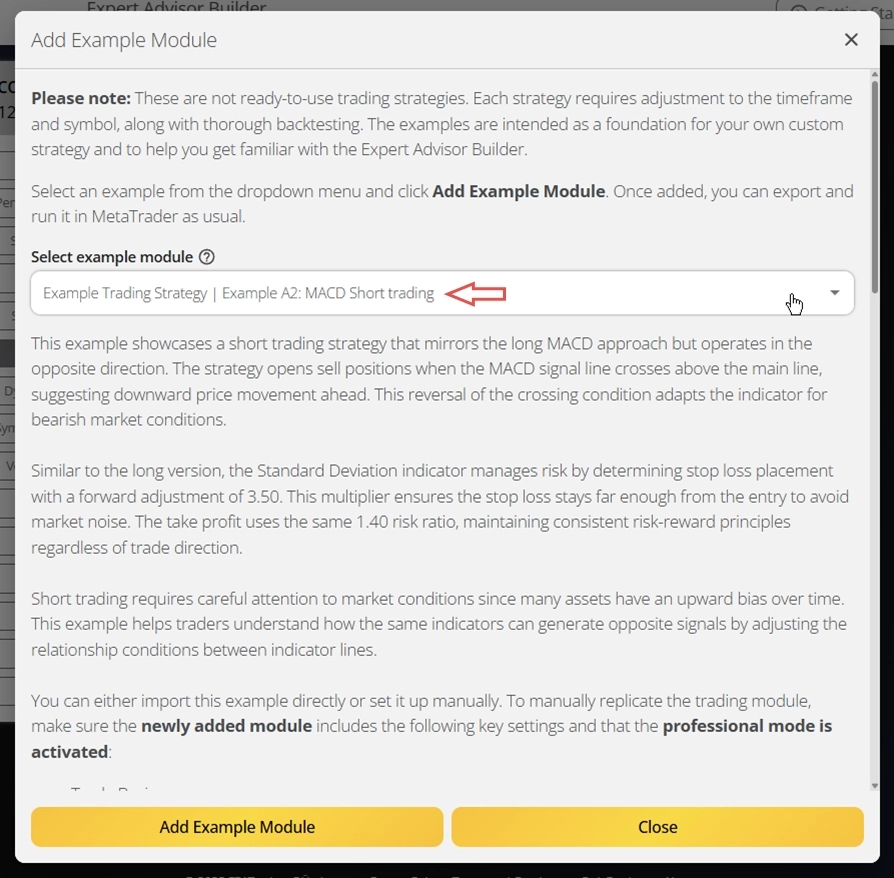
Passo 2: Escolha um exemplo da lista
Selecione Example Trading Strategy | Example A2: MACD Short trading. Este módulo complementa o módulo de MACD Long trading que você configurou manualmente na seção anterior. Os parâmetros são quase idênticos, exceto que este módulo abre operações short e combina o sinal do MACD e as linhas principais na ordem inversa.
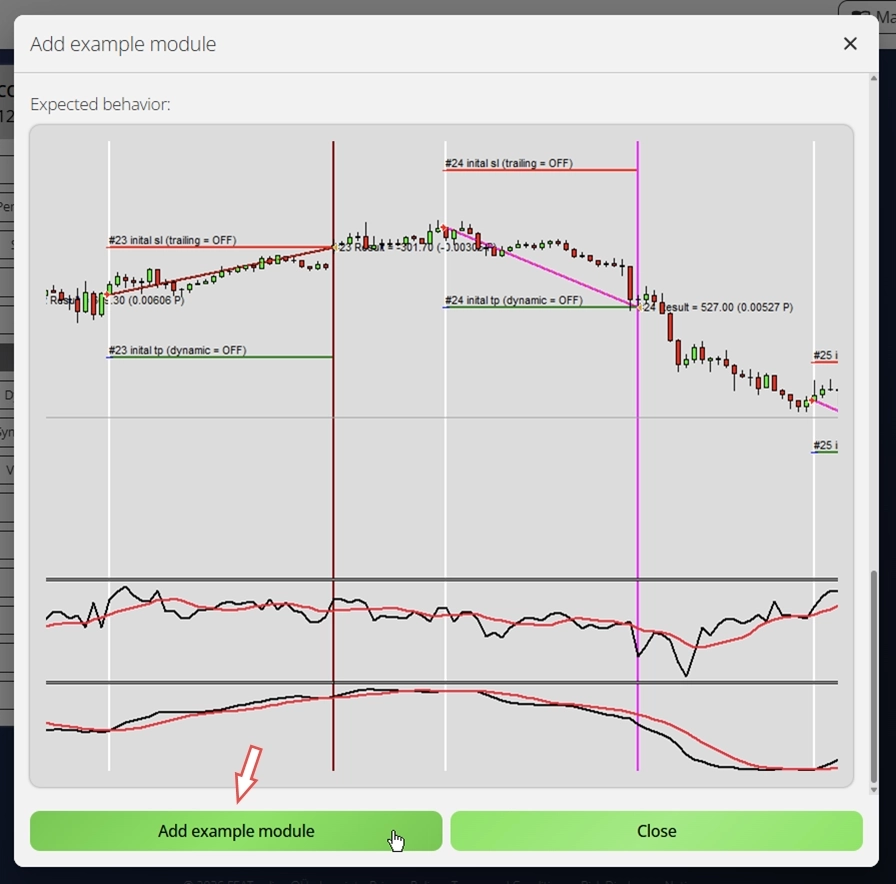
Passo 3: Importe o módulo selecionado e revise sua configuração
Por fim, conclua a importação clicando em Add Example Module. Isso cria um novo módulo de trading com todas as configurações já definidas de acordo com a descrição do exemplo.
Configuração concluída, eficiente e rápida, exatamente como deve ser. Vamos para o próximo passo.
Exporte os módulos de trading
Após criar seus módulos de trading, exportá-los e implantá-los é simples. Você pode exportar todos os módulos configurados juntos ou exportá-los um a um. Ao exportar todos os módulos de uma vez, eles são empacotados em um arquivo ZIP. Ao exportar individualmente, cada módulo é baixado como um arquivo de texto separado.
Passo 1: Exporte os módulos de trading configurados
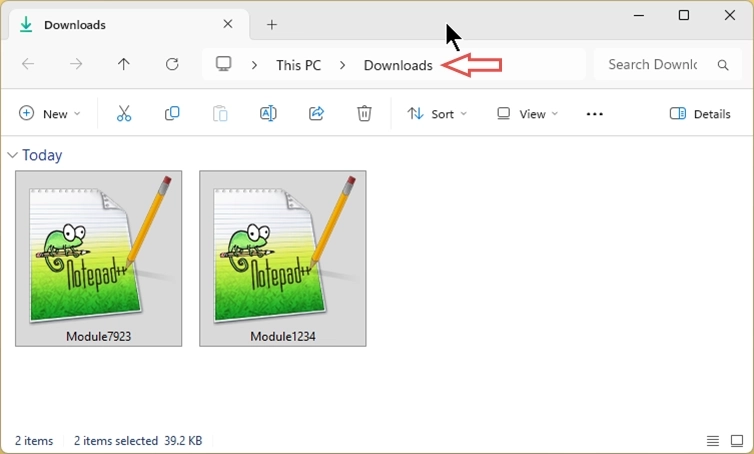
Abra o menu de contexto clicando nos três pontos ao lado do módulo na lista de módulos e selecione Export. Isso baixa um arquivo nomeado com o número do módulo (por exemplo, Module1234.txt). Mantenha o nome de arquivo original, pois é essencial que esses nomes permaneçam estáticos e únicos. Exporte ambos os módulos usando este método.
Após isso, você pode localizar os módulos na sua pasta de downloads padrão.
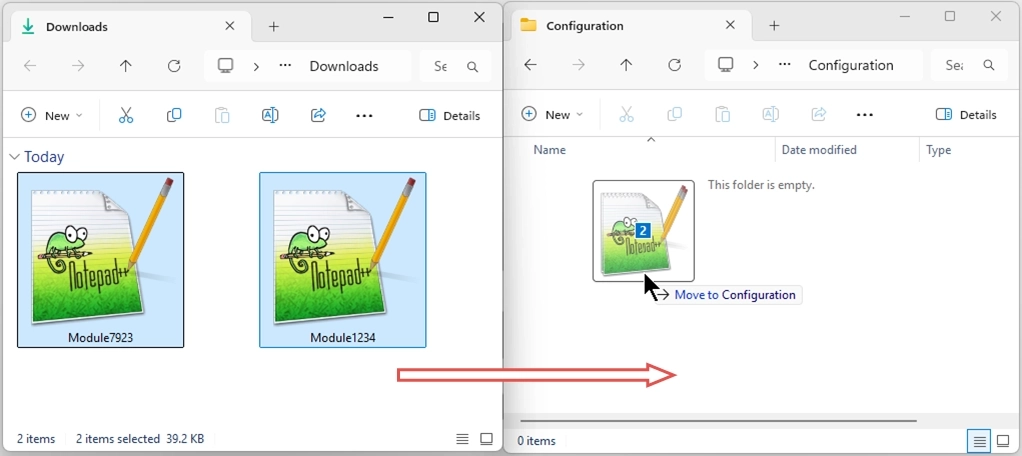
Passo 2: Mova os módulos para a pasta de entrada do Expert Advisor Builder
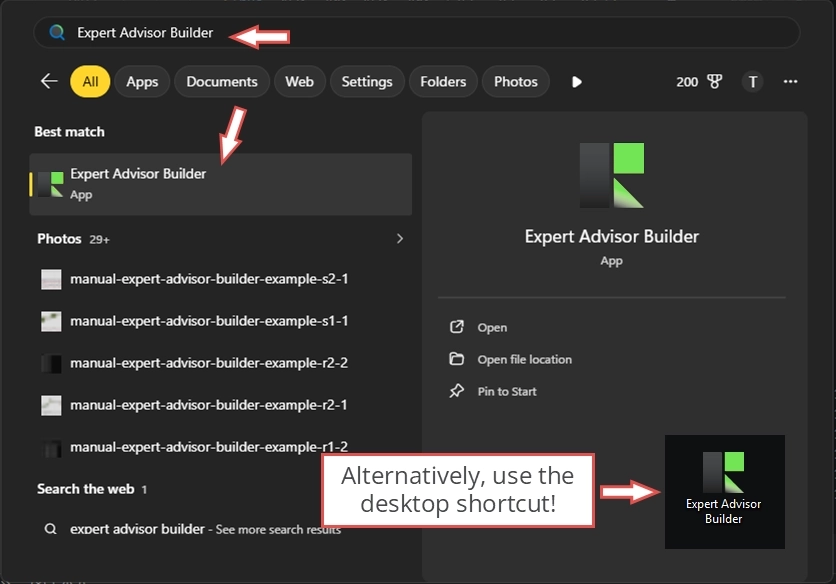
Durante a instalação, uma pasta de entrada padrão foi criada no diretório do aplicativo Expert Advisor Builder. Você pode encontrar essa pasta de várias maneiras:
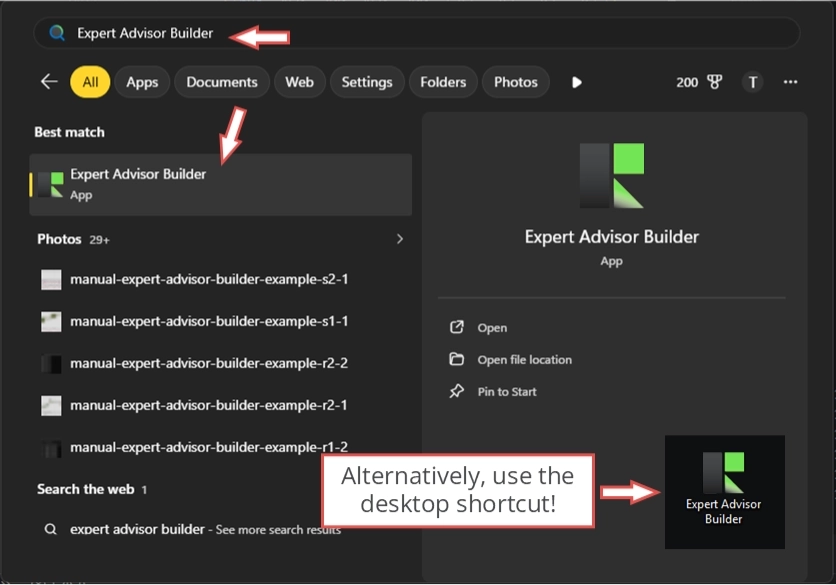
- Abra o menu Iniciar do Windows, pesquise por Expert Advisor Builder e abra essa pasta. Em seguida, navegue até Expert Advisor Builder\default\Configuration
- Use o atalho do Expert Advisor Builder na área de trabalho e navegue até Expert Advisor Builder\default\Configuration
- Abra o Windows Explorer e cole este caminho na barra de endereços: %AppData%\MetaQuotes\Terminal\Common\Files\Expert Advisor Builder\default\Configuration
Qualquer um desses métodos mostrará a mesma pasta vazia. O Expert Advisor Builder lê apenas os arquivos colocados nessa pasta específica. Mova os dois arquivos de módulo baixados para este local.
Você notará que o caminho inclui uma pasta chamada default. Esta é a pasta de perfil. Você pode criar vários perfis e escolher qual usar ao iniciar o Expert Advisor Builder. Esse recurso é especialmente útil para organizar diferentes sistemas de trading para várias finalidades, por exemplo, um perfil para testar estratégias e outro para trading ao vivo. Em todos os casos, os arquivos de módulo devem sempre ser colocados em uma subpasta chamada Configuration.
Por enquanto, continuaremos usando a pasta default.
Copie automaticamente os arquivos de módulo
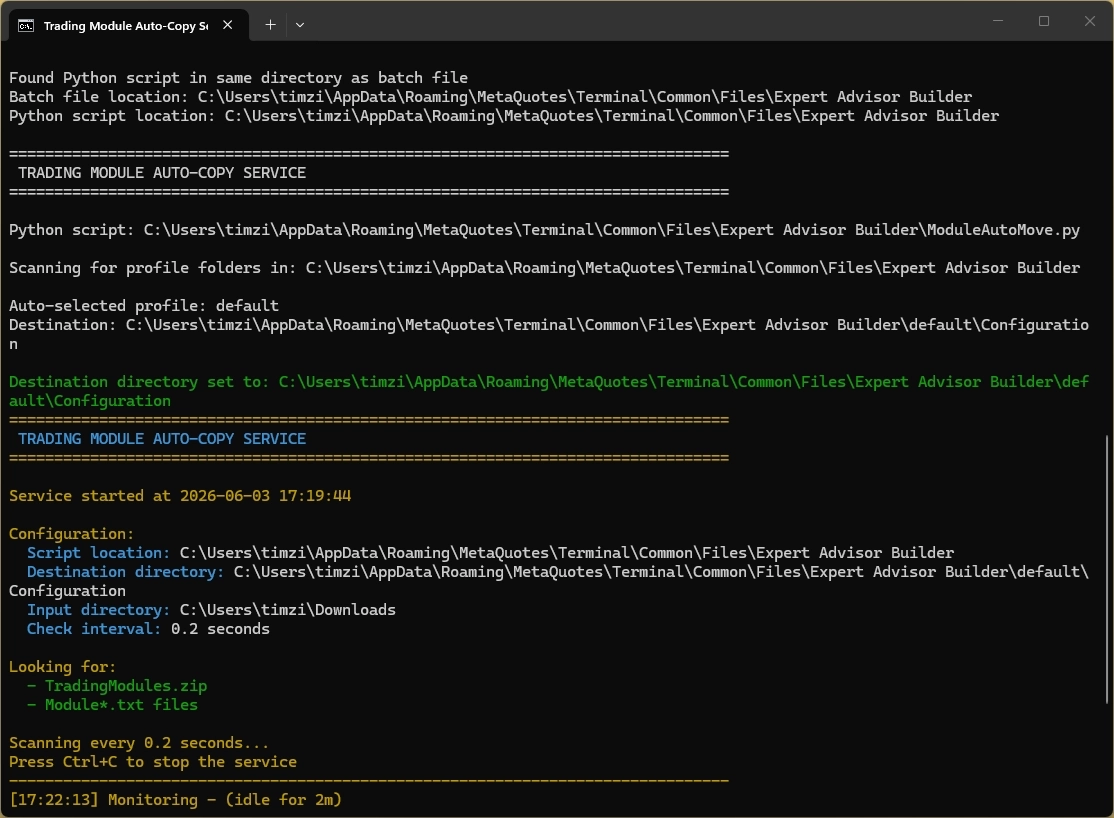
Mover os arquivos de módulo manualmente funciona bem, mas se você os exportar com frequência, isso rapidamente se torna repetitivo. Como alternativa conveniente, o script ModuleAutoMove_START pode copiar seus arquivos de módulo exportados da pasta de downloads para a pasta Configuration correta automaticamente.
Na primeira vez que você executar o ModuleAutoMove_START, ele baixa uma pequena instância portátil do Python, de modo que nada precisa ser instalado no seu sistema. Se você criou mais de um perfil, o script permite escolher para qual pasta de perfil os módulos devem ser copiados.
A partir daí, o script simplesmente monitora sua pasta de downloads padrão. Assim que um ou mais arquivos de módulo novos aparecerem lá, ele faz backup dos arquivos de módulo existentes na pasta Configuration selecionada e copia os novos no lugar. Dessa forma, seus módulos exportados mais recentes ficam sempre disponíveis para o Expert Advisor Builder sem nenhum tratamento manual de arquivos.
Teste sua estratégia de trading
CAUTION
Toda estratégia de trading precisa de testes rigorosos com dados de tick de qualidade. As estratégias raramente funcionam de forma lucrativa sem otimização. Preparamos um artigo explicando os métodos de teste adequado de estratégias. Se você precisar de dados de tick de alta qualidade, explore nossa solução MT5 Tick Data. Você pode baixar dados de tick precisos com até 20 anos de registros históricos.
Testar suas estratégias antes da implantação ao vivo é essencial. Usaremos o testador de estratégias padrão do MetaTrader, que se mostrou uma das melhores ferramentas para backtesting. Recomendamos fortemente o uso do testador de estratégias do MetaTrader 5 porque ele realiza backtests com precisão de tick. No entanto, o testador de estratégias do MetaTrader 4 continua sendo útil, pois é mais simples e rápido, especialmente no modo de teste visual.
Passo 1: Abra a plataforma MetaTrader onde você instalou o Expert Advisor Builder
Passo 2: Configure o Strategy Tester
CAUTION
Para este guia de início, estamos usando o testador de estratégias do MetaTrader 4. O processo no MetaTrader 5 é quase idêntico.
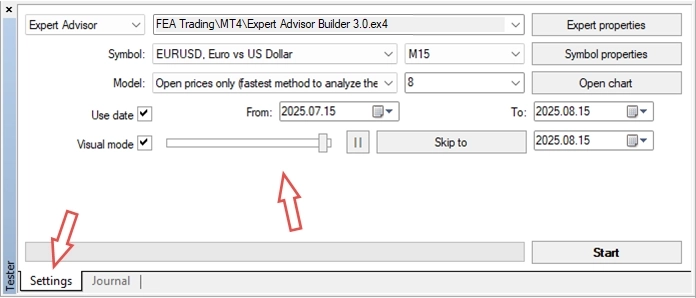
Certifique-se de que a janela do strategy tester esteja aberta. Você pode acessá-la em View → Strategy Tester ou pressionando Ctrl+R. Na janela do strategy tester, vá para a aba Settings. Configure estas opções:
- Expert Advisor: Expert Advisor Builder.ex4
- Symbol: EURUSD
- Period: M15
- Spread: 8
- Model: Open price only
- Use date: Enabled
- Date range (From/To): Últimas 4 semanas
- Visual mode: Enabled
- Optimization: Disabled
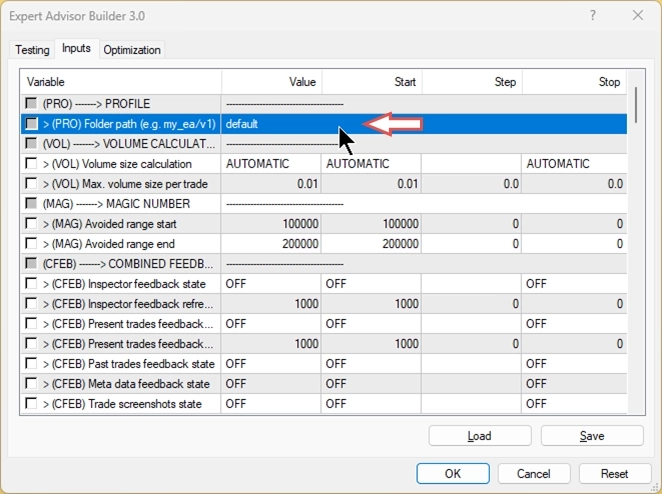
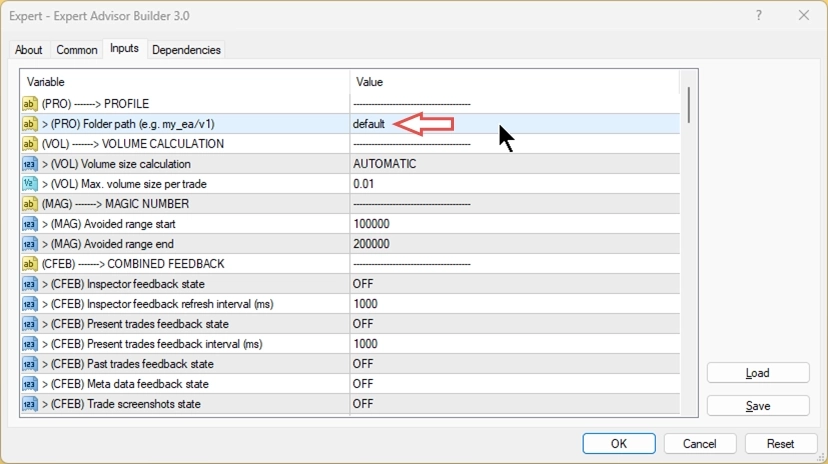
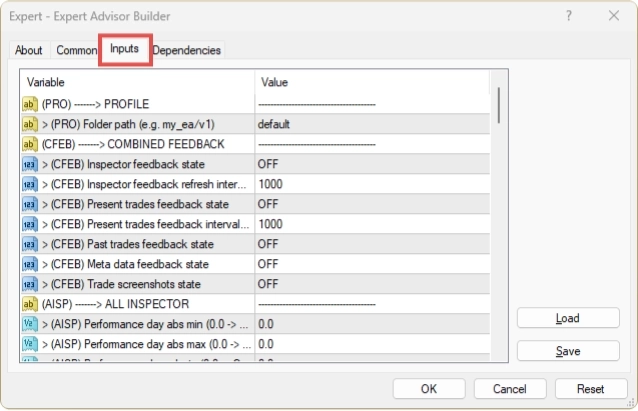
Vamos examinar as Expert Properties para visualizar os inputs. Em geral, todos os parâmetros necessários para definir a lógica de trading vêm dos arquivos de módulo de trading. Você não precisa modificar nenhum input neste momento. No entanto, em > (PRO) Folder path (e.g. my_eas/v1), você pode ver que default está configurado. Como explicado anteriormente, isso indica ao sistema para usar os módulos de trading da pasta padrão. Você pode alterar isso para apontar para qualquer outro perfil, se necessário. Uma explicação completa de todos os parâmetros de input e de como otimizar módulos de trading está disponível no manual do usuário do Expert Advisor Builder.
Passo 3: Inicie o teste de estratégia
Feche esta janela e clique em Start para executar o teste de estratégia. Após um breve momento, o teste começa e exibe uma tela semelhante à seguinte:
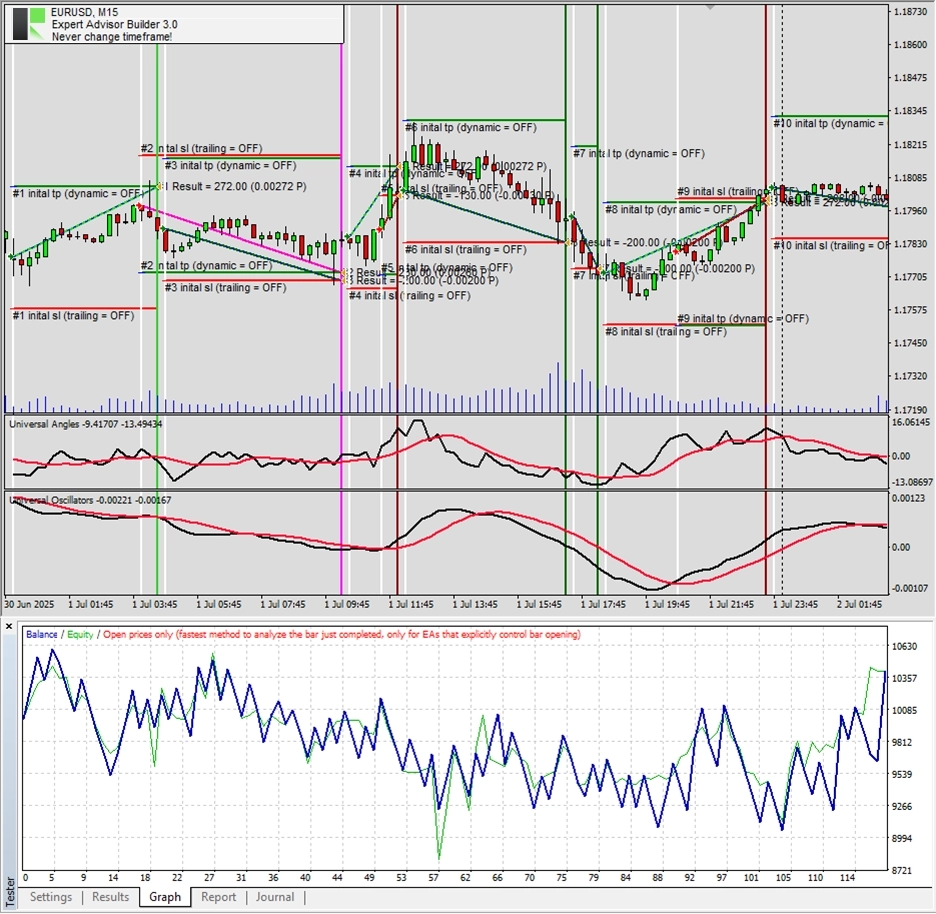
Parabéns! Você criou e testou com sucesso seu primeiro sistema de trading automatizado sem escrever nenhum código!
Ative em um gráfico ao vivo
CAUTION
Recomendamos fortemente concluir as etapas a seguir usando uma conta demo primeiro. Isso permite que você se familiarize com o processo em um ambiente sem risco.
Você pode querer executar o sistema de trading em um gráfico ao vivo em vez de apenas no modo de testador. Tenha em mente que a estratégia descrita neste guia tem fins de demonstração apenas e provavelmente não será lucrativa em sua forma atual. Estratégias lucrativas exigem testes e adaptação rigorosos, o que ainda não foi feito neste caso. Ainda assim, vamos ativar o sistema de trading em um gráfico ao vivo e observar seu comportamento.
Passo 1: Preparando o gráfico ao vivo
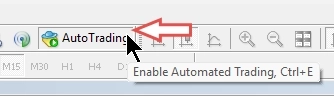
Certifique-se de que as configurações da sua conta permitem o trading automatizado antes de prosseguir.
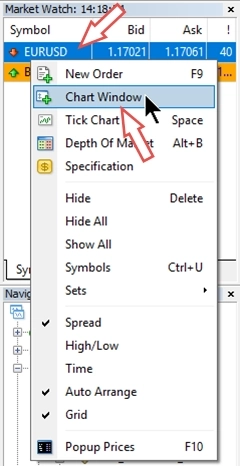
Em seguida, abra um novo gráfico EURUSD com um timeframe de 15 minutos (M15).
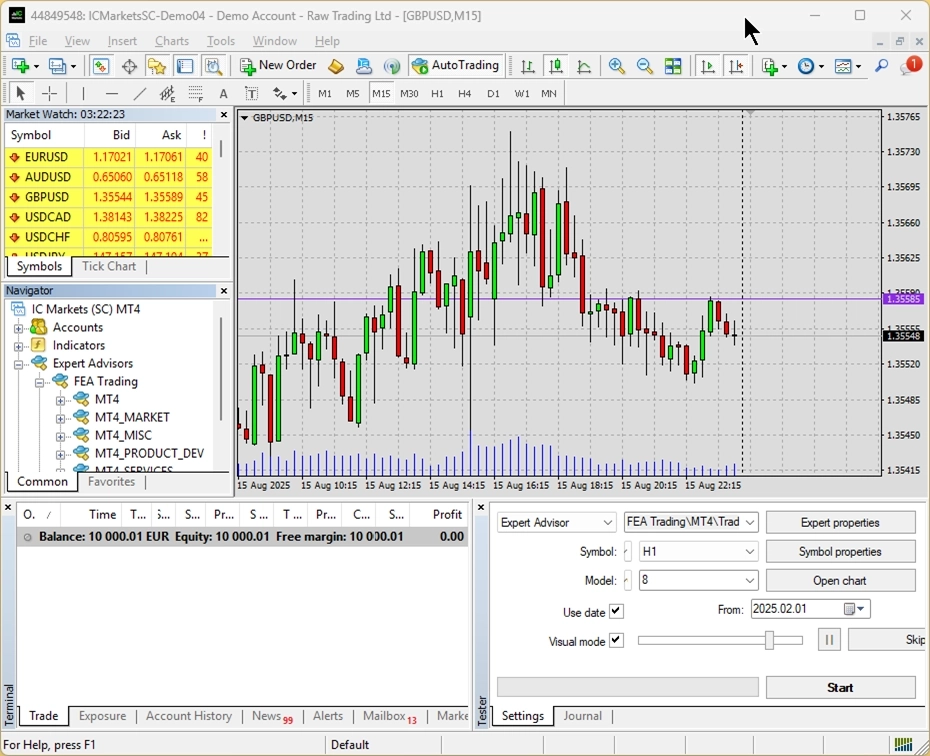
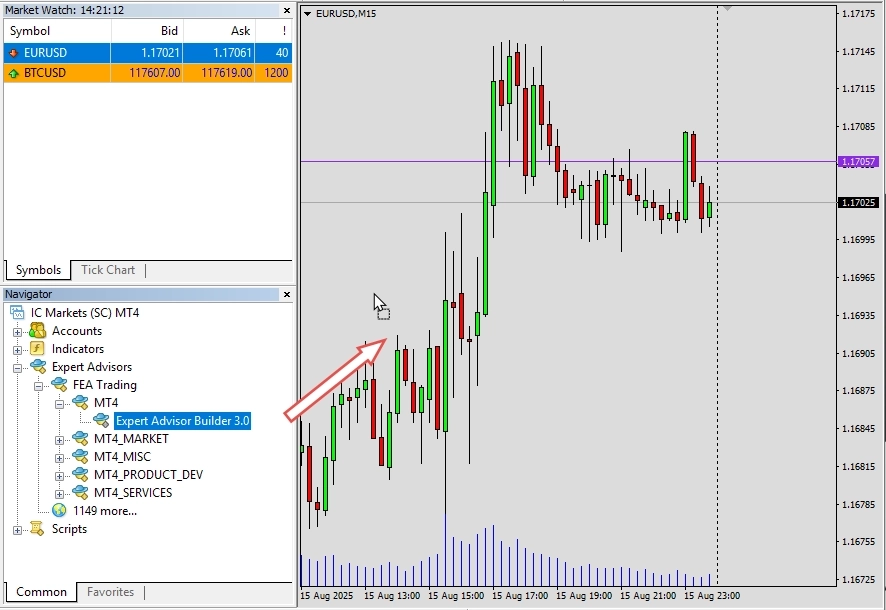
Passo 2: Ative o Expert Advisor Builder
No painel Navigator, arraste o Expert Advisor Builder para o seu gráfico EURUSD M15. Você o encontrará na visão Navigator em Experts. Se o aplicativo ainda não estiver listado, basta clicar com o botão direito em qualquer lugar do Navigator e escolher Refresh para atualizar a visão.
O diálogo de configurações deve aparecer automaticamente. Nele, confirme que o caminho da pasta aponta para sua pasta com os módulos testados, que deve ser a pasta default para o demo. Quando tudo parecer correto, clique em OK para iniciar. Se você vir um emoji de rosto feliz no canto superior direito do gráfico, está pronto!
Passo 3: Confirme que seus módulos de trading estão carregados
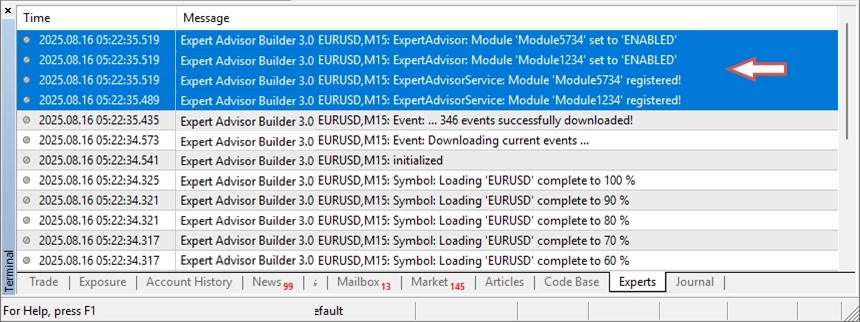
Na visão do terminal (View → Terminal), navegue até a aba Experts. Aqui você pode ver que ambos os módulos colocados na pasta default foram carregados e ativados.
Seu sistema de trading automatizado está agora em operação!
Passo opcional: Altere o status de trading
Como mencionado anteriormente, você pode alterar o status de trading de um módulo mesmo enquanto ele está em execução. Para fazer isso, abra um dos arquivos de módulo de trading e modifique a segunda linha, seguindo as instruções fornecidas dentro do arquivo de módulo. No exemplo abaixo, alteramos o estado de trading do módulo. Você verá essa mudança refletida imediatamente na aba Experts.
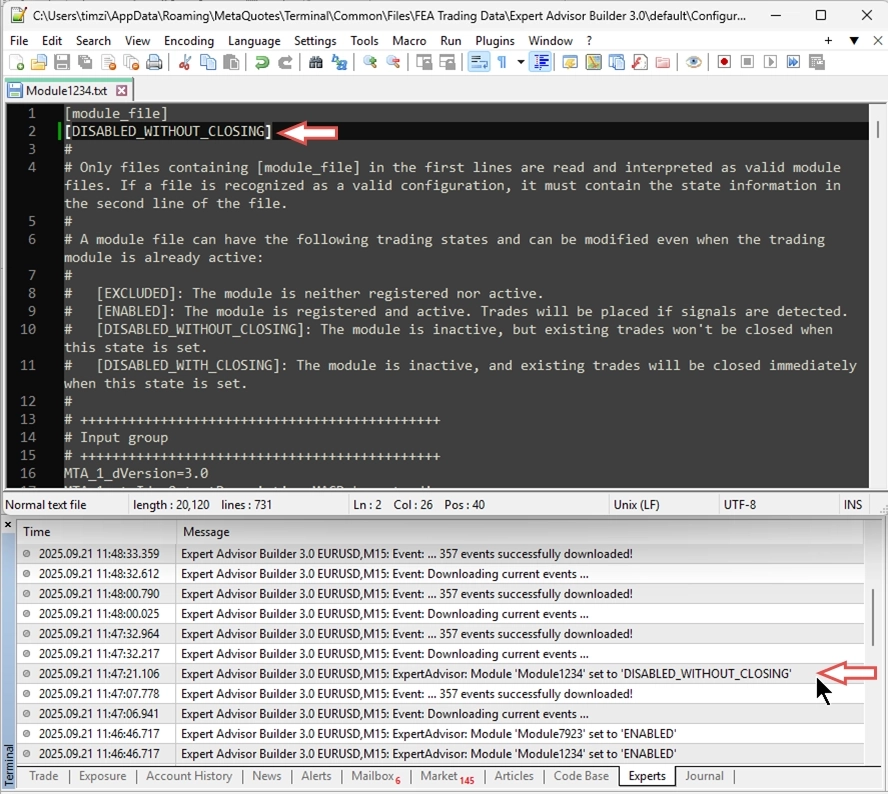
Enquanto um módulo está em execução, você pode alterar seu estado de trading a qualquer momento.
Modificações iterativas
Muitas estratégias de trading automatizadas exigem ajustes ocasionais. Você tem duas opções para fazer alterações:
Opção 1: Edição manual de arquivo
Você pode modificar diretamente os arquivos de módulo de trading usando um editor de texto. Localize o parâmetro que deseja alterar e atualize seu valor. Este método requer uma compreensão profunda da estrutura do arquivo de módulo.
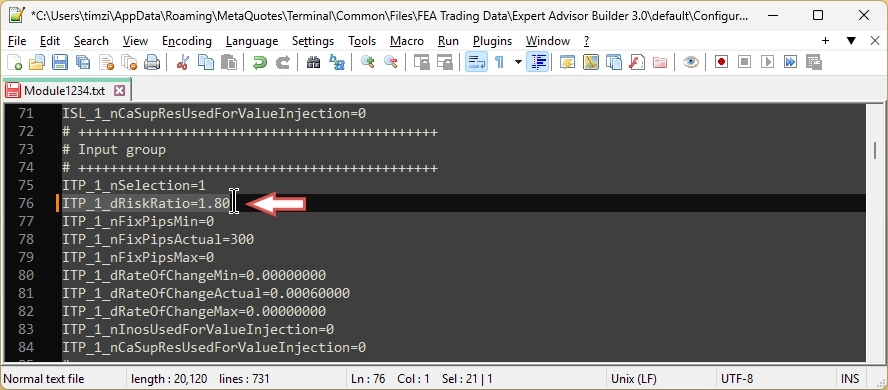
Para substituir e recarregar todos os parâmetros durante a execução, primeiro mova o módulo para fora da pasta de entrada e depois adicione a versão mais recente. Simplesmente “substituir” o arquivo não funcionará devido a restrições de segurança. Se o módulo não estiver em execução, você pode simplesmente ajustar as configurações e salvar o arquivo de texto.
Opção 2: Usando o Expert Advisor Builder
Reimporte o módulo de trading para o Expert Advisor Builder, faça suas alterações na interface e exporte o módulo atualizado.
Para este guia, vamos nos concentrar na Opção 2: editar módulos por meio do Expert Advisor Builder.
Passo 1: Importe o módulo de trading
Para começar, abra o Expert Advisor Builder e clique em Import module ou arraste e solte um ou mais arquivos de módulo diretamente na interface web.
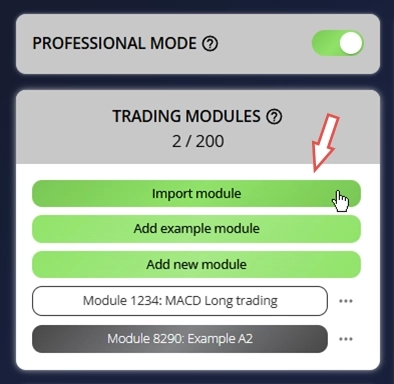
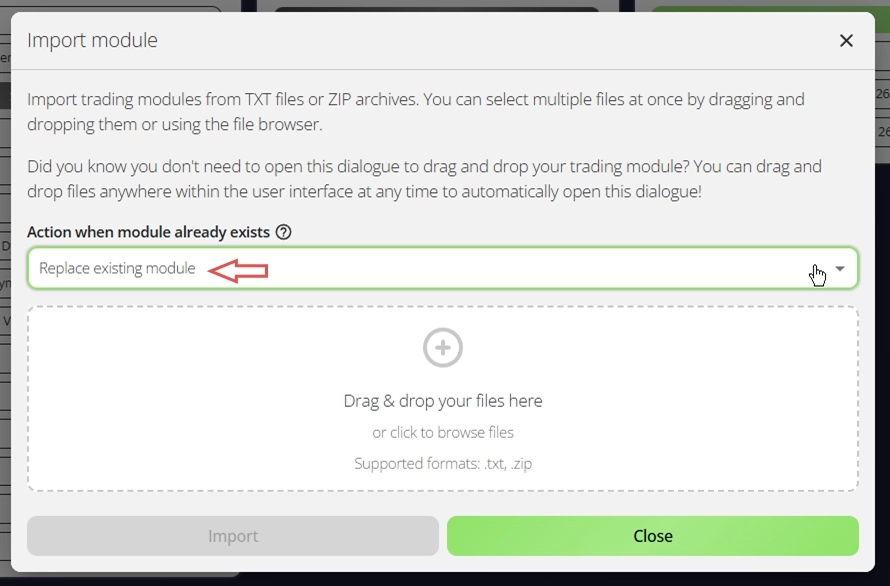
Esta ação acionará automaticamente o diálogo de importação. Por padrão, o sistema está configurado para ignorar qualquer módulo que já exista. No entanto, neste caso, você vai querer substituir esse comportamento selecionando a opção de substituir o módulo existente. Isso garante que o módulo que você está prestes a modificar seja o que está em uso, mantendo consistência e evitando conflitos de versão. Defina o seguinte parâmetro:
- Action when module already exists: Replace existing module
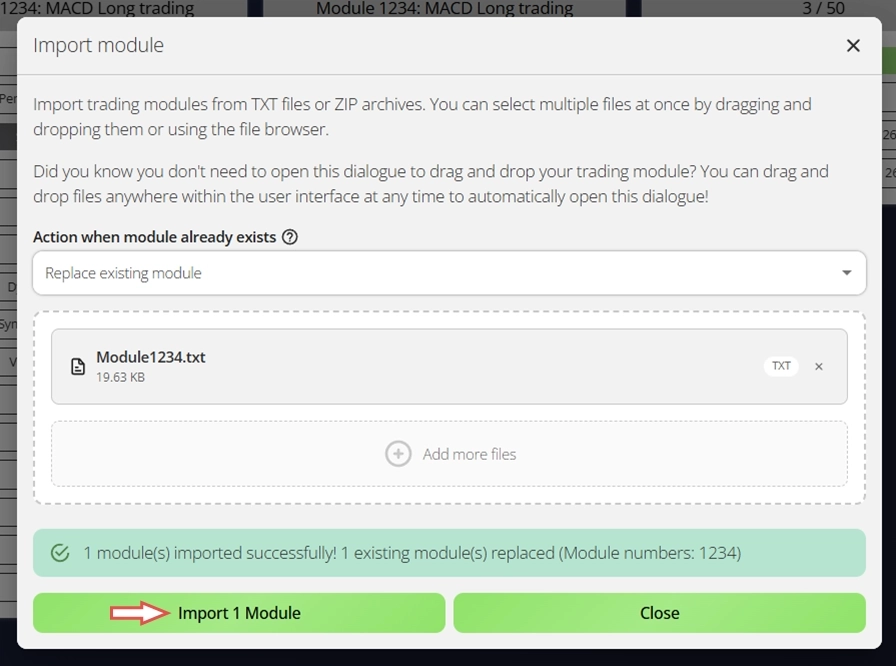
Passo 2: Carregue e modifique as configurações do módulo
Em seguida, arraste e solte seus arquivos de módulo da pasta de módulos designada para a interface. O sistema carregará instantaneamente todas as configurações relevantes, dando a você acesso imediato à configuração atual do módulo. A partir deste ponto, o fluxo de trabalho essencialmente é reiniciado, permitindo que você faça os ajustes necessários. Agora você pode modificar os parâmetros de acordo com seus requisitos, adaptando o módulo para refletir a lógica ou o comportamento de trading desejado.
Passo 3: Exporte e aplique o sistema de trading atualizado
Quando suas alterações estiverem concluídas, exporte o módulo de trading atualizado. Substitua o arquivo existente na pasta de perfil por esta versão recém-exportada para garantir que o sistema use sua configuração mais recente. Por fim, reinicie o Expert Advisor Builder. Esta etapa ativa o módulo atualizado e aplica suas alterações, permitindo que o ambiente de trading opere com as configurações revisadas.
Para substituir e recarregar arquivos de módulo durante a execução, primeiro mova o módulo para fora da pasta de entrada e depois adicione a versão mais recente. Simplesmente “substituir” o arquivo não funcionará devido a restrições de segurança.
Precisa de ajuda?
Muitas perguntas comuns já são respondidas em nossas perguntas frequentes sobre o Expert Advisor Builder. Por favor, consulte-as primeiro. Se ainda precisar de ajuda, nossa equipe de suporte ficará feliz em ajudar.
Desinstalar
Existem várias maneiras comuns de desinstalar o Expert Advisor Builder no Windows:
Pelo menu Iniciar (mais fácil): Abra o menu Iniciar do Windows, encontre o Expert Advisor Builder na lista de aplicativos, clique com o botão direito nele e selecione Desinstalar.
Pelas Configurações do Windows: Vá para Configurações > Aplicativos > Aplicativos instalados (no Windows 11) ou Configurações > Aplicativos > Aplicativos e recursos (no Windows 10), localize o Expert Advisor Builder na lista, clique nele e escolha Desinstalar.
Pelo Painel de Controle: Abra o Painel de Controle e vá para Programas > Programas e Recursos, selecione o Expert Advisor Builder na lista e clique em Desinstalar.
Qualquer um desses métodos removerá completamente o aplicativo do seu computador.
Ajuda integrada
Acreditamos que a documentação mais eficaz fica ao lado do recurso que ela descreve. Por isso, nossa aplicação web Expert Advisor Builder inclui ajuda integrada diretamente na interface. Basta passar o cursor sobre qualquer ícone de ponto de interrogação para ver informações detalhadas sobre a configuração correspondente. Na maioria dos casos, isso fornecerá informações suficientes sobre a funcionalidade de cada parâmetro.
Além da ajuda inline, oferecemos uma ampla variedade de exemplos estendidos que demonstram conceitos básicos e avançados. Esses exemplos são projetados para ser facilmente reproduzíveis e servem como modelos práticos para suas próprias estratégias. Passe o cursor sobre o nome do componente para ver quais exemplos o incluem e o descrevem.
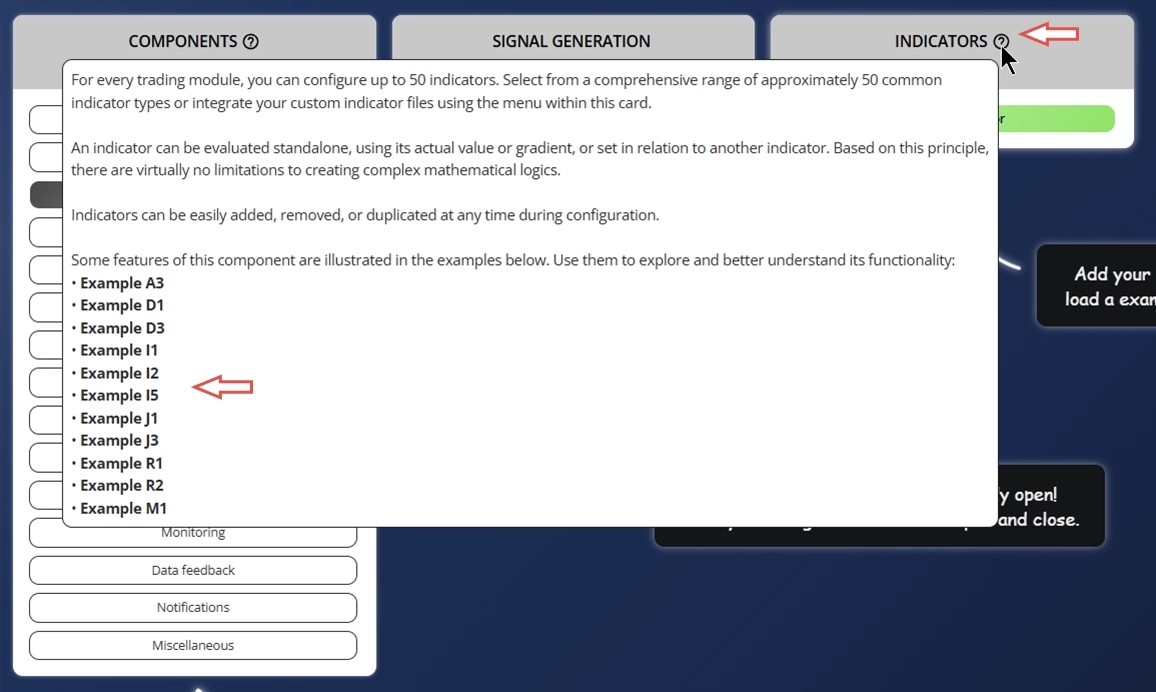
Para saber como acessar os exemplos e explorar a coleção completa, consulte a seção de exemplos.
Manuais estendidos disponíveis
Estamos continuamente expandindo nossa documentação detalhada. Por enquanto, consulte a lista abaixo para ver quais artigos estendidos estão disponíveis atualmente.
| Capítulo | Observação | Link |
|---|---|---|
| Configuração/PRO - Perfil | Configure a localização da pasta de perfil usada pelo MetaTrader. Essa configuração determina onde os dados específicos do usuário, configurações e estados de módulo são armazenados e recuperados. | Link |
| Configuração/VOL - Cálculo de Volume | Defina os parâmetros de input que controlam a lógica geral de cálculo de volume. Essas configurações influenciam todos os módulos de trading simultaneamente, garantindo tratamento de volume consistente em todo o sistema. | Link |
| Configuração/MAG - Número Mágico | Defina os parâmetros de número mágico usados para identificar exclusivamente as operações iniciadas por diferentes módulos. A configuração adequada garante o rastreamento preciso das operações. | Link |
| Configuração/CFEB - Feedback Combinado | Ative e configure o recurso de dados de feedback. Esta funcionalidade coleta dados relacionados a operações que podem ser usados para gerar estatísticas, manter um diário de trading e apoiar análises pós-operação abrangentes. | Link |
| Configuração/AISP - Inspetor Global | Ajuste os parâmetros do recurso de inspetor integrado. Este componente monitora métricas de desempenho agregadas, incluindo lucratividade, drawdown e resumos estatísticos em todos os módulos de trading ativos. | Link |
| Configuração/FIHA - Gerenciamento de Arquivos | Controle a frequência com que o MetaTrader atualiza e acessa os arquivos de módulo. Essas configurações ajudam a gerenciar os intervalos de sincronização de dados e a acelerar o teste de estratégias. | Link |
| Configuração/NOTI - Notificações | Configure o sistema de notificações integrado. Os parâmetros de input aqui definem como e quando os alertas são acionados, incluindo eventos de operação, avisos do sistema e atualizações de desempenho. | Link |
| Configuração/PAOV - Substituição de Parâmetros | Configure o recurso de substituição de parâmetros, especialmente útil durante o processo de otimização de estratégias do MetaTrader. Isso permite a substituição e o teste dinâmicos de parâmetros normalmente usados a partir de arquivos de módulo. | Link |
Configuração de inputs
Este capítulo fornece uma explicação detalhada de cada parâmetro de input, permitindo que você configure o Expert Advisor Builder de acordo com suas necessidades. Você encontrará todas essas configurações na aba Inputs que aparece quando você inicia o Expert Advisor Builder em um gráfico ou nas configurações de inputs do Strategy Tester. Esta janela pode ter aparência diferente no MetaTrader 5, mas funciona de forma essencialmente idêntica.
Para otimizar os parâmetros de input, considere usar o strategy tester do MetaTrader.
PRO - Perfil
Pasta do aplicativo
Durante a instalação, uma pasta de dados do aplicativo é criada automaticamente. Se ela não existir quando o Expert Advisor Builder for iniciado pela primeira vez, o aplicativo a gerará por padrão. Você pode localizar essa pasta por vários métodos:
- Abra o menu Iniciar do Windows, pesquise por Expert Advisor Builder e abra essa pasta. Em seguida, navegue até Expert Advisor Builder\default\Configuration
- Use o atalho do Expert Advisor Builder na área de trabalho e navegue até Expert Advisor Builder\default\Configuration
- Abra o Windows Explorer e cole este caminho na barra de endereços: %AppData%\MetaQuotes\Terminal\Common\Files\Expert Advisor Builder\default\Configuration
Qualquer um desses métodos mostrará a mesma pasta. O Expert Advisor Builder lê apenas os arquivos colocados nessa pasta específica. O diretório do aplicativo suporta o uso de pastas de perfil, permitindo separação clara e organização de múltiplos sistemas de trading automatizados.
Pasta de perfil
O Expert Advisor Builder processa os arquivos de módulo de trading e armazena os dados de feedback resultantes em uma pasta de perfil designada. Essa pasta é selecionada na inicialização do aplicativo, permitindo que os usuários mantenham configurações separadas para diferentes cenários de trading. Por exemplo, um perfil pode ser usado para trading ao vivo, enquanto outro é reservado exclusivamente para teste de estratégias. Essa separação garante flexibilidade e clareza em configurações operacionais distintas.
| Variável de input no MetaTrader | Valor padrão | Comentário |
|---|---|---|
| > (PRO) Profile folder (e.g. my_ea/v1) | default | O parâmetro deve ter menos de 63 caracteres. O caractere / pode ser usado para navegar por subpastas. Observe que o uso de determinados caracteres, incluindo <, >, :, ’, \, |, ? e *, é proibido. |
O texto de input selecionado define um caminho de navegação relativo à pasta do aplicativo. Usando barras (/) você pode especificar níveis mais profundos dentro da estrutura de pastas. Em todos os casos, o input é interpretado como um segmento de caminho começando na pasta do aplicativo. Isso permite a organização flexível de pastas de perfil em subdiretórios, desde que o caminho completo não exceda o limite de 63 caracteres. Cada pasta de perfil deve conter uma subpasta chamada Configuration. Se essa pasta estiver ausente, o aplicativo a inicializará automaticamente com arquivos de exemplo padrão. O módulo de trading deve ser colocado diretamente na pasta Configuration para funcionar corretamente.
No input de string, tags especiais podem ser usadas para inserir dinamicamente valores de parâmetros. Essas tags são substituídas automaticamente em tempo de execução pelos dados correspondentes que referenciam. As seguintes tags estão disponíveis:
- {BROKER} - Substituído pelo nome do corretor (por exemplo, ICMarkets International Ltd.)
- {ACCOUNT} - Substituído pelo número da conta (por exemplo, 3424245)
- {SERVER} - Substituído pelo nome do servidor (por exemplo, ICMarketsMT5-1)
- {SYMBOL} - Substituído pelo símbolo de trading ao qual o interpretador é aplicado (por exemplo, EURUSD)
- {TIMEFRAME} - Substituído pelo timeframe do gráfico (por exemplo, M15)
- {TYPE} - Substituído pelo tipo de conta (Demo ou Live)
- {MODE} - Substituído pelo modo operacional (Real ou Tester)
Por exemplo, inserir {SYMBOL}-{TIMEFRAME}-{MODE} como string de input resultará na pasta de perfil sendo resolvida para EURUSD-M15-Tester quando o Expert Advisor Builder for aplicado a um gráfico EURUSD M15 e o aplicativo for executado no modo strategy tester. Se a pasta especificada não existir, o aplicativo a inicializará automaticamente com conteúdo padrão.
VOL - Cálculo de volume
Volume por operação
Cada módulo de trading normalmente inclui sua própria lógica de gestão de risco e dinheiro para calcular o volume ótimo de operação com base em suas métricas de risco definidas individualmente. No entanto, quando múltiplos módulos são combinados, pode ser benéfico ignorar esses cálculos de volume individuais para controle simplificado.
Para substituir as configurações de volume por módulo e aplicar uma abordagem unificada, os seguintes parâmetros de input do aplicativo podem ser usados:
| Variável de input no MetaTrader | Valor padrão | Comentário |
|---|---|---|
| > (VOL) Volume size calculation | AUTOMATIC | Opções: -AUTOMATIC -LIMITED |
| > (VOL) Max. volume size per trade | 0.01 | Se o valor preciso não puder ser utilizado devido à restrição de tamanho mínimo de lote, o sistema usará o tamanho mínimo de lote como padrão. O valor de input não pode ser menor que 0. |
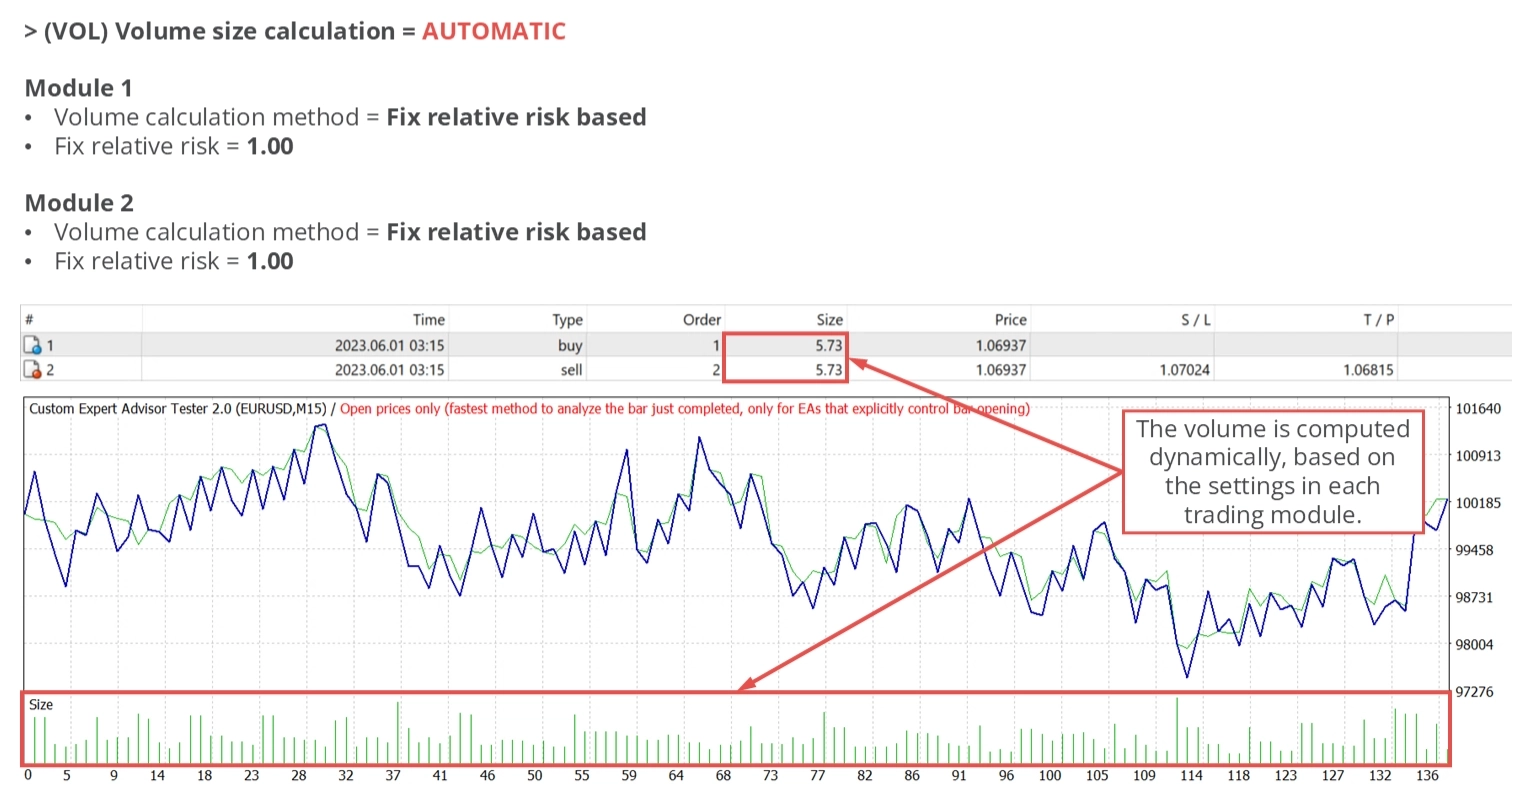
> (VOL) Volume size calculation = AUTOMATIC
No modo automático (configuração padrão), os volumes de operação se ajustam dinamicamente com base nas configurações de gestão de risco e dinheiro de cada módulo. Isso garante que o sistema permaneça dentro de seus limites de desempenho e drawdown definidos. As variações no volume geralmente se devem a diferentes níveis de Stop Loss entre as operações. Quando o modo automático está ativo, o parâmetro de input > (VOL) Max. volume size per trade é ignorado, permitindo o uso total das preferências configuradas de cada módulo.
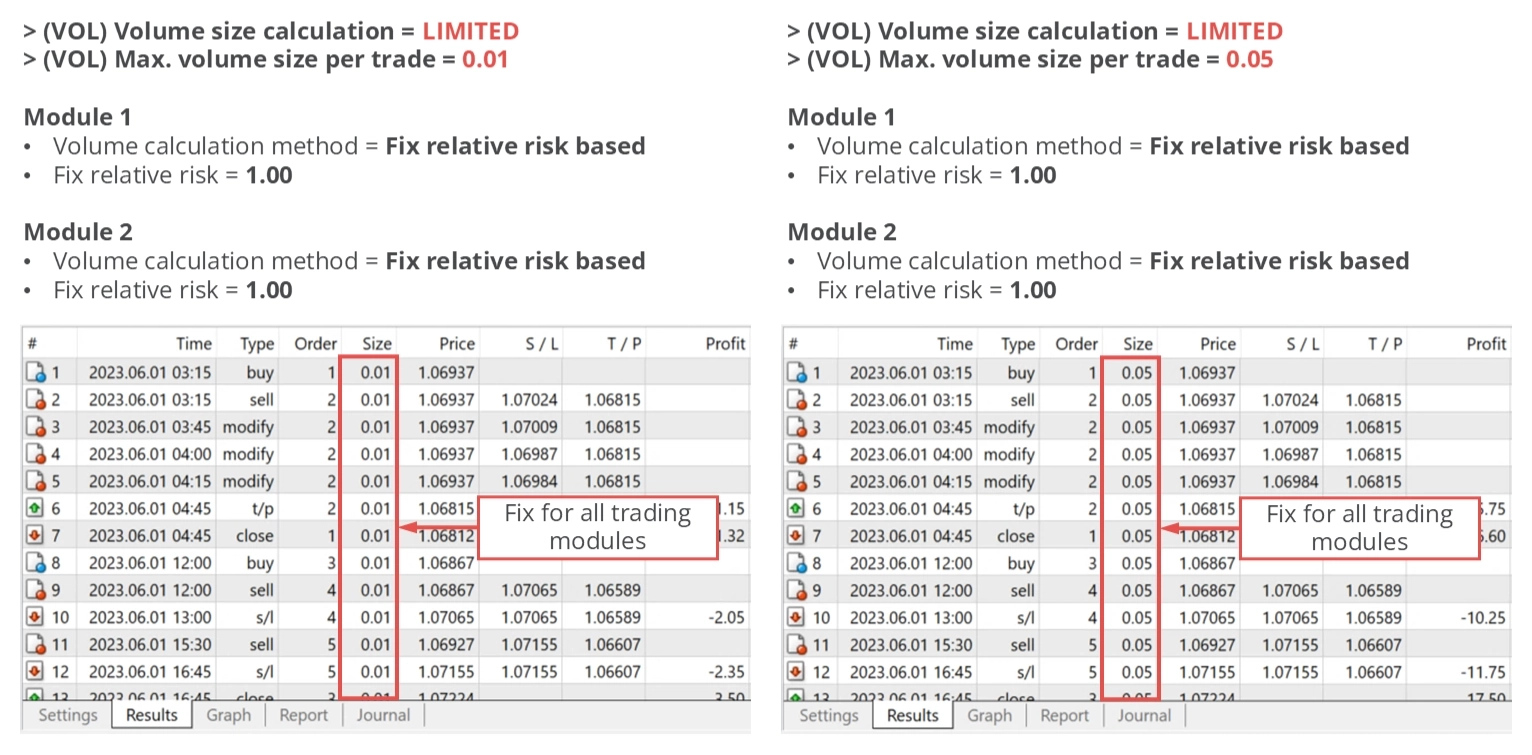
> (VOL) Volume size calculation = LIMITED
A segunda opção de cálculo de volume impõe um tamanho máximo de operação usando o parâmetro de input > (VOL) Max. volume size per trade. Nenhuma operação excederá esse limite. No entanto, essa configuração atua como um teto, não como um valor fixo. Os módulos de trading individuais ainda podem escolher volumes menores com base em sua lógica interna. Nesses casos, o valor menor é usado. Os corretores frequentemente definem tamanhos mínimos e máximos de lote por símbolo, o que pode limitar ainda mais o volume de operação. Se você pretende aplicar um valor fixo ao volume, use o recurso de substituição de parâmetros em vez disso.
MAG - Número mágico
Parâmetros para o número mágico
Um número mágico é um identificador único que agrupa todas as operações iniciadas por um aplicativo específico. No contexto do MetaTrader, isso é utilizado para evitar interferências entre diferentes aplicativos. Por exemplo, se os aplicativos A e B usam 123456 e 654321 como seus números mágicos, cada operação que esses aplicativos abrem será marcada com esses números. Idealmente, cada aplicativo deve modificar apenas as operações configuradas com seu número mágico. O Expert Advisor Builder adere estritamente a essa regra.
| Variável de input no MetaTrader | Valor padrão | Comentário |
|---|---|---|
| > (MAG) Avoided range start | 100000 | O valor de input não pode ser menor que 0. |
| > (MAG) Avoided range end | 200000 | O valor de input não pode ser menor que 0. |
Muitos aplicativos de terceiros permitem especificar qual número mágico deve ser usado. No entanto, o Expert Advisor Builder opera com um princípio diferente. Seus parâmetros de input > (MAG) Avoided range start e > (MAG) Avoided range end definem um intervalo dentro do qual um número mágico não deve ser pesquisado e usado.
Seu Expert Advisor Builder pesquisará automaticamente um número mágico disponível no restante do intervalo de números. Todos os aplicativos FEA Trading seguem este princípio. Para garantir que os aplicativos não usem os mesmos números mágicos, há um mecanismo para evitar que um número mágico seja usado duas vezes.
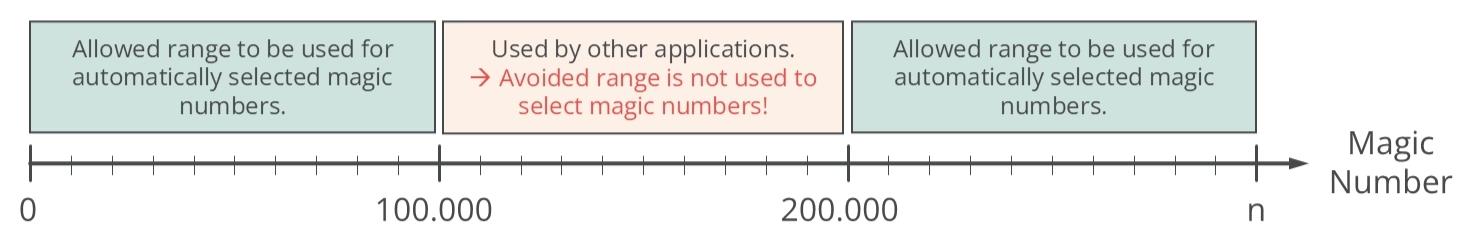
A ilustração acima explica esse princípio usando uma reta numérica. Supondo que > (MAG) Avoided range start seja definido como 100000 e > (MAG) Avoided range end seja definido como 200000, o número mágico selecionado aleatoriamente pode ser qualquer valor entre 0 e 99999 e acima de 200000. Todos os aplicativos usam 100000 e 200000 como valores padrão, portanto é recomendado configurar qualquer outro aplicativo de terceiros com um número mágico dedicado entre 100000 e 200000.
Se você operar apenas aplicativos FEA Trading, não é necessário modificar esses parâmetros de input.
CFEB - Feedback combinado
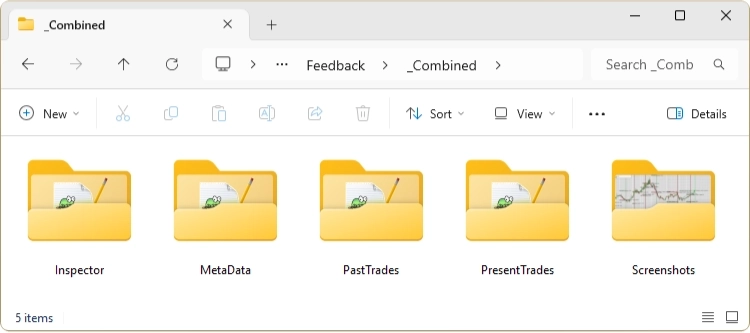
O recurso de feedback combinado complementa o sistema de feedback específico do módulo gravando e retornando métricas-chave agregadas em todos os módulos atualmente executados. Ao contrário do inspetor específico do módulo, esse recurso se concentra em cinco aspectos principais, cada um armazenado em um local dedicado na pasta de perfil. Consulte a tabela abaixo para uma visão geral detalhada dos parâmetros de input relevantes para esta seção.
| Variável de input no MetaTrader | Valor padrão | Comentário |
|---|---|---|
| > (CFEB) Inspector feedback state | OFF | Registra as métricas de desempenho mais recentes, estatísticas de drawdown e diagnósticos do sistema. Caminho na pasta de perfil: /Feedback/_Combined/Inspector/Inspector.csv Opções: -OFF -ON |
| > (CFEB) Inspector feedback refresh interval (ms) | 1000 | Define com que frequência o arquivo de feedback do inspetor é atualizado. Valores menores resultam em operações de arquivo mais frequentes, o que pode retardar significativamente a execução no modo Strategy Tester devido ao aumento de I/O em disco. Por outro lado, valores maiores reduzem a carga do sistema, mas podem comprometer a granularidade do feedback. Para operação ao vivo, um intervalo de 1000 ms geralmente oferece um bom equilíbrio entre desempenho e precisão dos dados. |
| > (CFEB) Present trades feedback state | OFF | Captura todas as operações abertas atualmente. Útil para monitoramento em tempo real e tomada de decisões. Caminho na pasta de perfil: /Feedback/_Combined/PresentTrades/PresentTrades.csv Opções: -OFF -ON |
| > (CFEB) Present trades feedback interval (ms) | 1000 | Define com que frequência as operações abertas são registradas no arquivo de feedback. Valores menores aumentam a frequência de registro e a carga do sistema, o que pode afetar o desempenho durante o backtesting. Um intervalo de 1000 ms é geralmente ideal para operação ao vivo. |
| > (CFEB) Past trades feedback state | OFF | Registra operações concluídas. Este conjunto de dados é ideal para gerar diários de trading ou analisar o desempenho do sistema usando algoritmos externos. Caminho na pasta de perfil: /Feedback/_Combined/PastTrades/PastTrades.csv Opções: -OFF -ON |
| > (CFEB) Meta data feedback state | OFF | Armazena metadados do sistema, como hora de início, caminho da pasta de perfil e outras informações contextuais. Caminho na pasta de perfil: /Feedback/_Combined/MetaData/MetaData.csv Opções: -OFF -ON |
| > (CFEB) Trade screenshots state | OFF | Quando ativado, captura screenshots em cada evento de abertura e fechamento de operação. Esses visuais auxiliam na análise pós-operação e na documentação. Este recurso pode retardar significativamente a execução no modo Strategy Tester. Caminho na pasta de perfil: /Feedback/_Combined/Screenshots/ Opções: -OFF -ON |
Quando todos os recursos de feedback combinado estão ativados, a pasta de saída aparecerá da seguinte forma:
AISP - Inspetor global
O Expert Advisor Builder emprega um mecanismo de inspetor que calcula continuamente o desempenho atual e o drawdown em tempo real. Como você já sabe, cada módulo de trading tem o mesmo recurso, mas denominado Monitoring. A principal diferença com o All Inspector é que este algoritmo agrega os resultados de cada módulo de trading ativado para monitorar o desempenho e o drawdown geral. Isso significa que, se um limite de drawdown ou desempenho definido for atingido, todos os módulos de trading incluídos serão desativados, mesmo que os inspetores individuais de um módulo não tenham atingido seus limites individuais.
Desempenho - Proteção diária
O mecanismo de inspetor pode ser configurado para interromper o trading assim que um limite de desempenho diário especificado for atingido usando os parâmetros de input descritos na tabela abaixo. Esses parâmetros estabelecem os limites mínimos e máximos absolutos e relativos diários. Um valor zero desativa efetivamente o limite.
| Variável de input no MetaTrader | Valor padrão | Comentário |
|---|---|---|
| > (AISP) Performance day abs min (0.0 -> OFF) | 0.0 | Se o patrimônio da conta estiver em $10.000 e o valor mínimo for definido como -100, o trading será suspenso se o patrimônio cair abaixo de $9.900. O trading será retomado no início do próximo dia, com o patrimônio naquele momento usado como novo ponto de referência. O valor de input não pode ser maior que 0. |
| > (AISP) Performance day abs max (0.0 -> OFF) | 0.0 | Se o patrimônio da conta estiver em $10.000 e o valor mínimo for definido como 100, o trading será suspenso se o patrimônio subir acima de $10.100. O trading será retomado no início do próximo dia, com o patrimônio naquele momento usado como novo ponto de referência. O valor de input não pode ser menor que 0. |
| > (AISP) Performance day rel min (0.0 -> OFF) | 0.0 | Se o patrimônio da conta estiver em $10.000 e o valor mínimo for definido como -0,15, o trading será suspenso se o patrimônio cair abaixo de $9.850. O valor será redefinido e o trading será reativado no início do próximo dia. O patrimônio no início do próximo período serve como novo valor de referência para calcular os limites de desempenho. O valor de input não pode ser maior que 0. |
| > (AISP) Performance day rel max (0.0 -> OFF) | 0.0 | Se o patrimônio da conta estiver em $10.000 e o valor mínimo for definido como 0,15, o trading será suspenso se o patrimônio subir acima de $10.150. O valor será redefinido e o trading será reativado no início do próximo dia. O patrimônio no início do próximo período serve como novo valor de referência para calcular os limites de desempenho. O valor de input não pode ser menor que 0. |
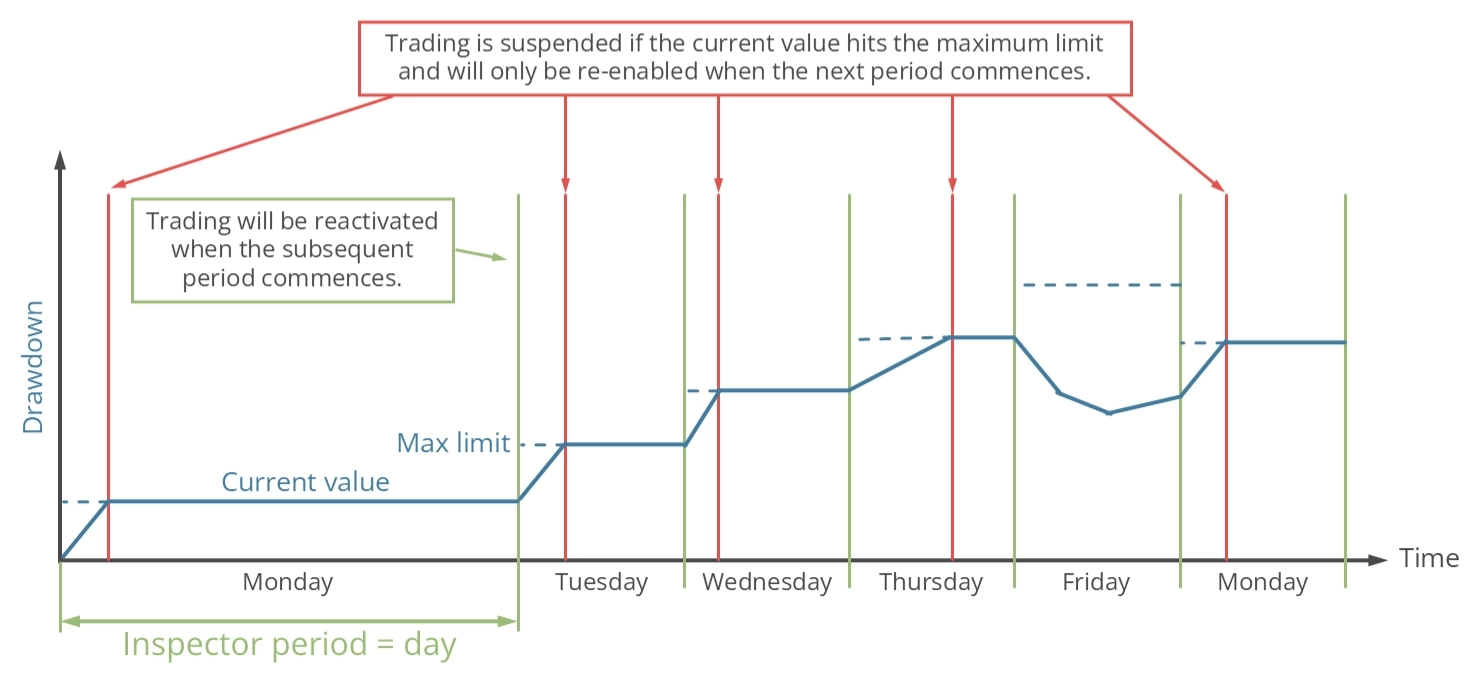
Existem parâmetros de input separados para os resultados de desempenho máximo e mínimo permitidos. Isso permite que o aplicativo suspenda a iniciação de novas operações quando resultados de desempenho positivos ou negativos forem alcançados. O diagrama abaixo elucida o princípio operacional da proteção diária do inspetor.
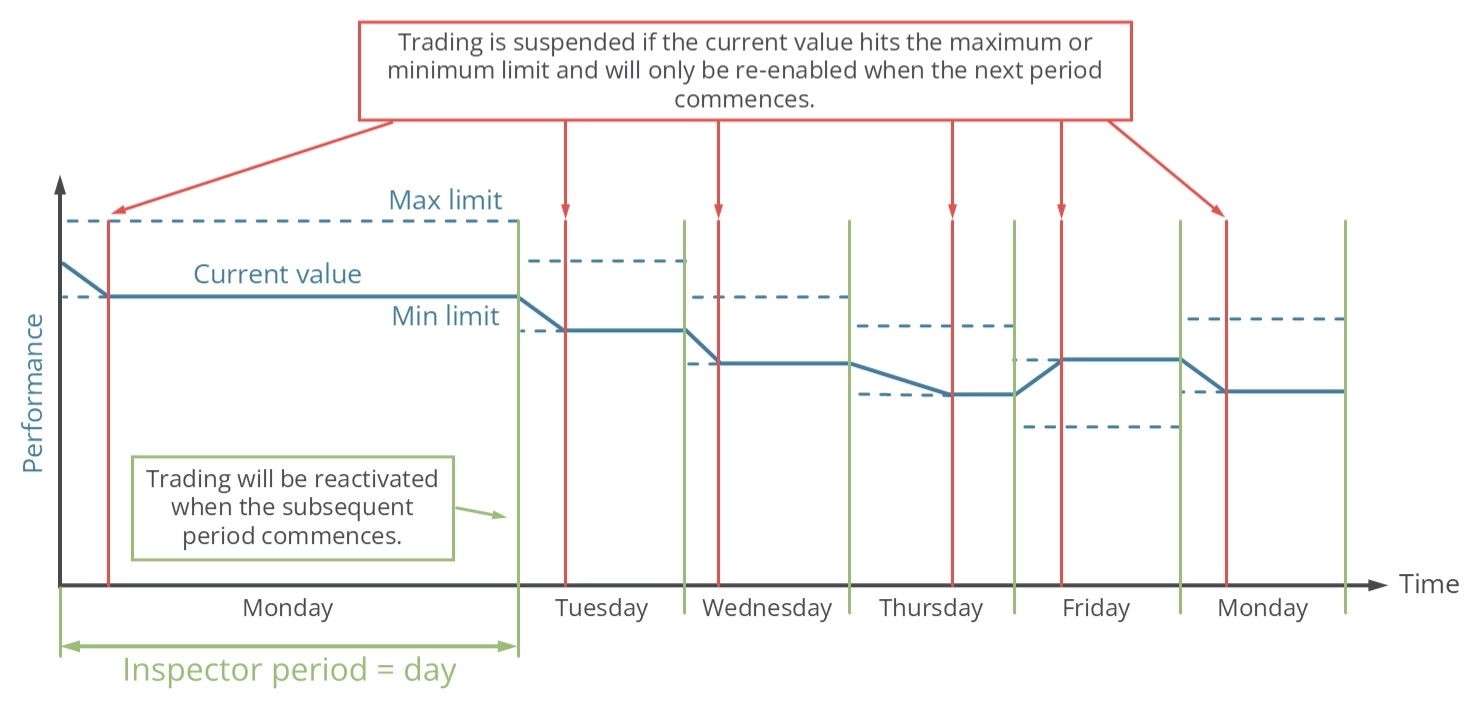
O período de inspeção é definido como um dia. Se o desempenho atingir o valor máximo ou mínimo dentro desse período, a capacidade de abrir novas operações será temporariamente suspensa. No início de um novo período, à meia-noite, o valor de desempenho do dia é redefinido e o trading é retomado. Esse ciclo continua indefinidamente.
Desempenho - Proteção semanal
O mecanismo de inspetor pode ser configurado para interromper o trading assim que um limite de desempenho semanal especificado for atingido usando os parâmetros de input descritos na tabela abaixo. Esses parâmetros estabelecem os limites mínimos e máximos absolutos e relativos semanais. Um valor zero desativa efetivamente o limite.
| Variável de input no MetaTrader | Valor padrão | Comentário |
|---|---|---|
| > (AISP) Performance week abs min (0.0 -> OFF) | 0.0 | Se o patrimônio da conta estiver em $10.000 e o valor mínimo for definido como -100, o trading será suspenso se o patrimônio cair abaixo de $9.900. O trading será retomado no início da próxima semana, com o patrimônio naquele momento usado como novo ponto de referência. O valor de input não pode ser maior que 0. |
| > (AISP) Performance week abs max (0.0 -> OFF) | 0.0 | Se o patrimônio da conta estiver em $10.000 e o valor mínimo for definido como 100, o trading será suspenso se o patrimônio subir acima de $10.100. O trading será retomado no início da próxima semana, com o patrimônio naquele momento usado como novo ponto de referência. O valor de input não pode ser menor que 0. |
| > (AISP) Performance week rel min (0.0 -> OFF) | 0.0 | Se o patrimônio da conta estiver em $10.000 e o valor mínimo for definido como -0,15, o trading será suspenso se o patrimônio cair abaixo de $9.850. O valor será redefinido e o trading será reativado no início da semana seguinte. O patrimônio no início do próximo período serve como novo valor de referência para calcular os limites de desempenho. O valor de input não pode ser maior que 0. |
| > (AISP) Performance week rel max (0.0 -> OFF) | 0.0 | Se o patrimônio da conta estiver em $10.000 e o valor mínimo for definido como 0,15, o trading será suspenso se o patrimônio subir acima de $10.150. O valor será redefinido e o trading será reativado no início da semana seguinte. O patrimônio no início do próximo período serve como novo valor de referência para calcular os limites de desempenho. O valor de input não pode ser menor que 0. |
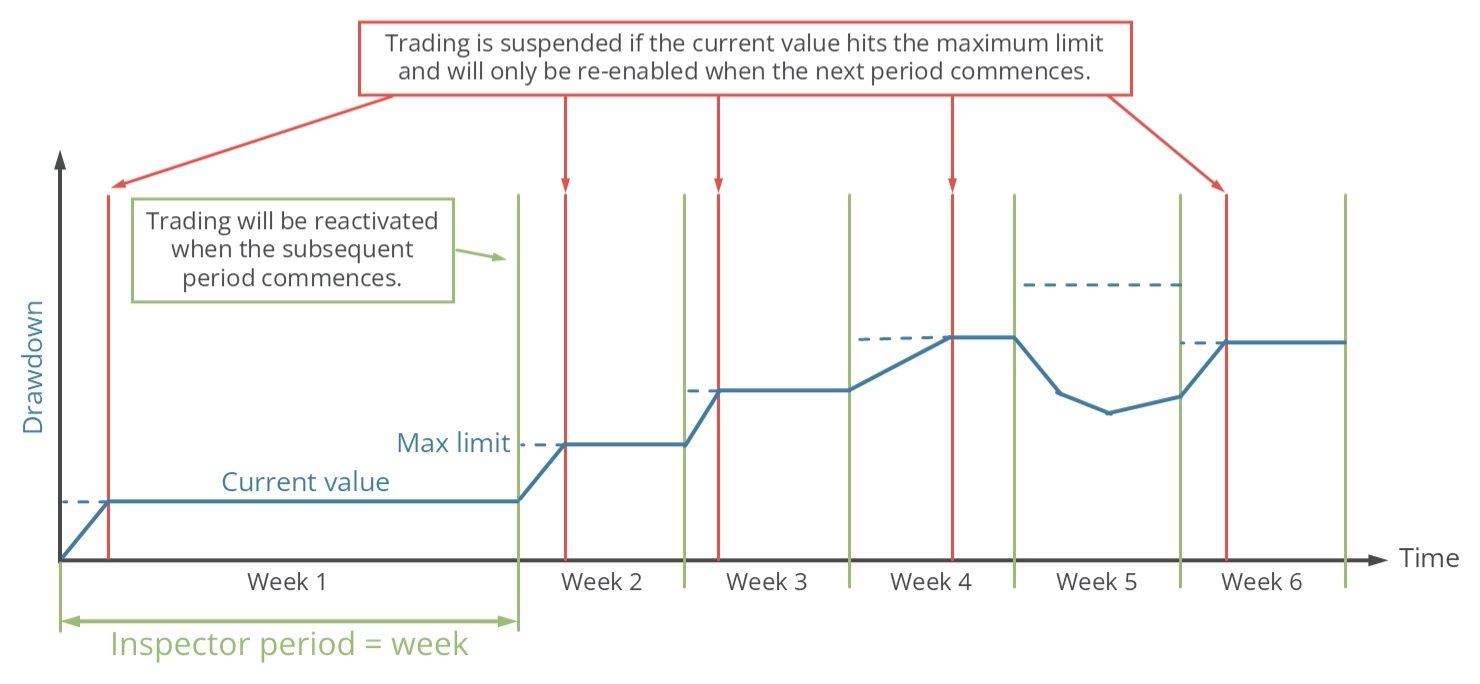
Existem parâmetros de input separados para os resultados de desempenho máximo e mínimo permitidos. Isso permite que o aplicativo suspenda a iniciação de novas operações quando resultados de desempenho positivos ou negativos forem alcançados. O diagrama abaixo elucida o princípio operacional da proteção semanal do inspetor.
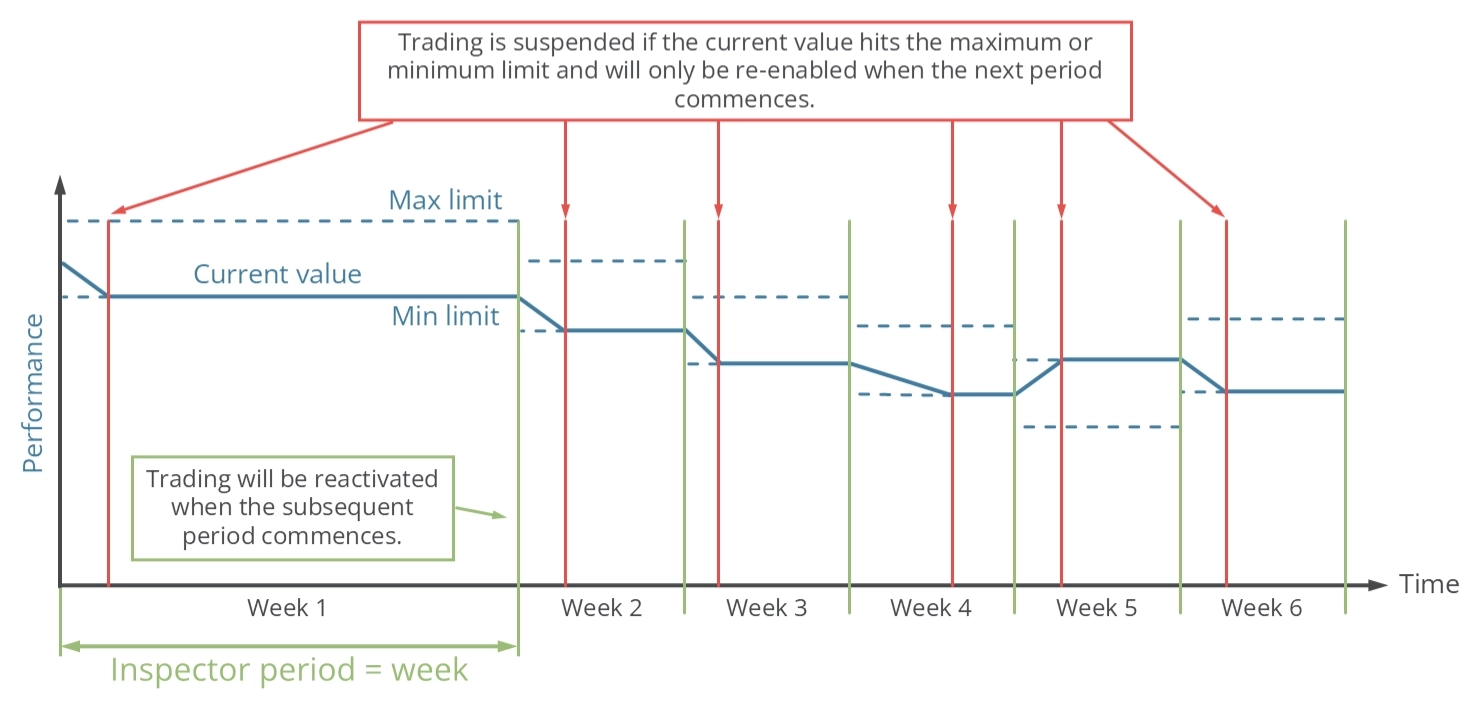
O período de inspeção é definido como uma semana. Se o desempenho atingir o valor máximo ou mínimo dentro desse período, a capacidade de abrir novas operações será temporariamente suspensa. No início de um novo período, que é à meia-noite entre sábado e domingo, o valor de desempenho da semana é redefinido e o trading é retomado. Esse ciclo continua indefinidamente.
Desempenho - Proteção mensal
O mecanismo de inspetor pode ser configurado para interromper o trading assim que um limite de desempenho mensal especificado for atingido usando os parâmetros de input descritos na tabela abaixo. Esses parâmetros estabelecem os limites mínimos e máximos absolutos e relativos mensais. Um valor zero desativa efetivamente o limite.
| Variável de input no MetaTrader | Valor padrão | Comentário |
|---|---|---|
| > (AISP) Performance month abs min (0.0 -> OFF) | 0.0 | Se o patrimônio da conta estiver em $10.000 e o valor mínimo for definido como -100, o trading será suspenso se o patrimônio cair abaixo de $9.900. O trading será retomado no início do próximo mês, com o patrimônio naquele momento usado como novo ponto de referência. O valor de input não pode ser maior que 0. |
| > (AISP) Performance month abs max (0.0 -> OFF) | 0.0 | Se o patrimônio da conta estiver em $10.000 e o valor mínimo for definido como 100, o trading será suspenso se o patrimônio subir acima de $10.100. O trading será retomado no início do próximo mês, com o patrimônio naquele momento usado como novo ponto de referência. O valor de input não pode ser menor que 0. |
| > (AISP) Performance month rel min (0.0 -> OFF) | 0.0 | Se o patrimônio da conta estiver em $10.000 e o valor mínimo for definido como -0,15, o trading será suspenso se o patrimônio cair abaixo de $9.850. O valor será redefinido e o trading será reativado no início do próximo mês. O patrimônio no início do próximo período serve como novo valor de referência para calcular os limites de desempenho. O valor de input não pode ser maior que 0. |
| > (AISP) Performance month rel max (0.0 -> OFF) | 0.0 | Se o patrimônio da conta estiver em $10.000 e o valor mínimo for definido como 0,15, o trading será suspenso se o patrimônio subir acima de $10.150. O valor será redefinido e o trading será reativado no início do próximo mês. O patrimônio no início do próximo período serve como novo valor de referência para calcular os limites de desempenho. O valor de input não pode ser menor que 0. |
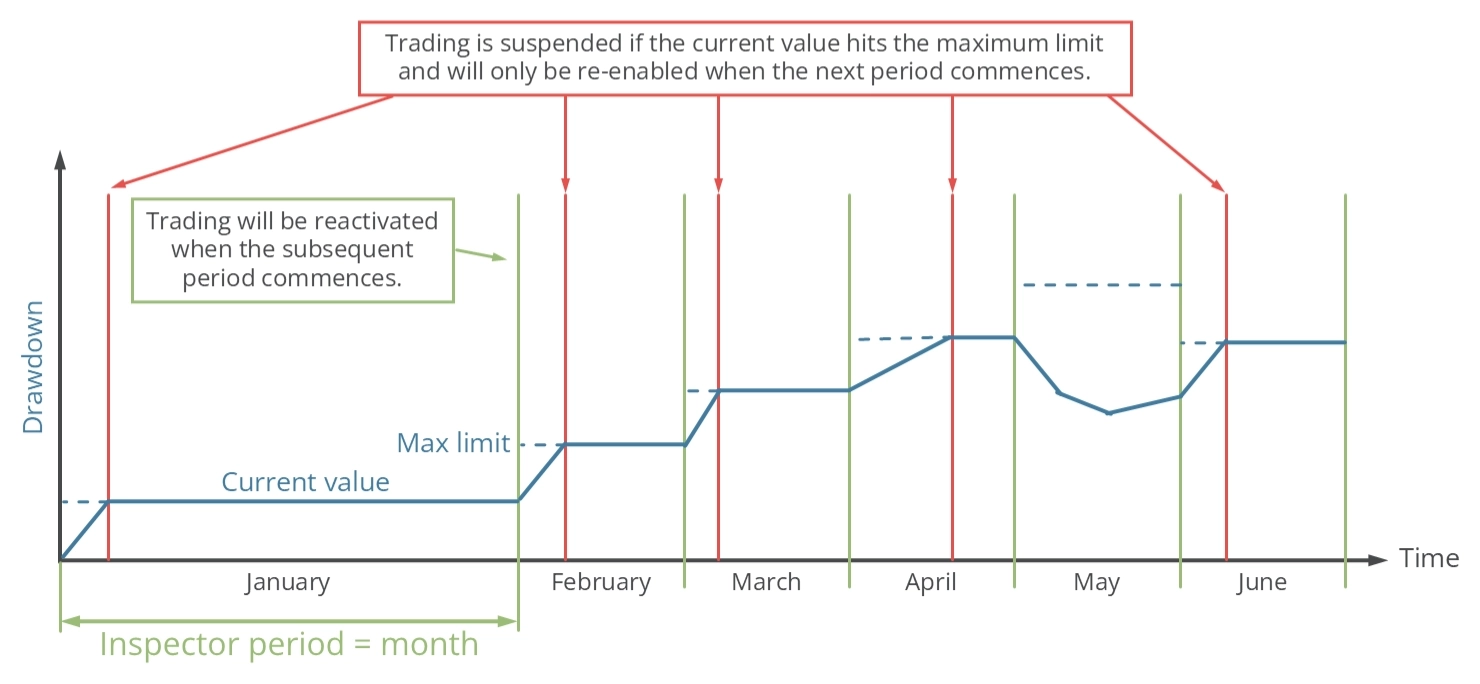
Existem parâmetros de input separados para os resultados de desempenho máximo e mínimo permitidos. Isso permite que o aplicativo suspenda a iniciação de novas operações quando resultados de desempenho positivos ou negativos forem alcançados. O diagrama abaixo elucida o princípio operacional da proteção mensal do inspetor.

O período de inspeção é definido como um mês. Se o desempenho atingir o valor máximo ou mínimo dentro desse período, a capacidade de abrir novas operações será temporariamente suspensa. No início de um novo período, que neste caso é o 1º dia do mês, o valor de desempenho do mês é redefinido e o trading é retomado. Esse ciclo continua indefinidamente.
Desempenho - Proteção anual
O mecanismo de inspetor pode ser configurado para interromper o trading assim que um limite de desempenho anual especificado for atingido usando os parâmetros de input descritos na tabela abaixo. Esses parâmetros estabelecem os limites mínimos e máximos absolutos e relativos anuais. Um valor zero desativa efetivamente o limite.
| Variável de input no MetaTrader | Valor padrão | Comentário |
|---|---|---|
| > (AISP) Performance year abs min (0.0 -> OFF) | 0.0 | Se o patrimônio da conta estiver em $10.000 e o valor mínimo for definido como -100, o trading será suspenso se o patrimônio cair abaixo de $9.900. O trading será retomado no início do próximo ano, com o patrimônio naquele momento usado como novo ponto de referência. O valor de input não pode ser maior que 0. |
| > (AISP) Performance year abs max (0.0 -> OFF) | 0.0 | Se o patrimônio da conta estiver em $10.000 e o valor mínimo for definido como 100, o trading será suspenso se o patrimônio subir acima de $10.100. O trading será retomado no início do próximo ano, com o patrimônio naquele momento usado como novo ponto de referência. O valor de input não pode ser menor que 0. |
| > (AISP) Performance year rel min (0.0 -> OFF) | 0.0 | Se o patrimônio da conta estiver em $10.000 e o valor mínimo for definido como -0,15, o trading será suspenso se o patrimônio cair abaixo de $9.850. O valor será redefinido e o trading será reativado no início do próximo ano. O patrimônio no início do próximo período serve como novo valor de referência para calcular os limites de desempenho. O valor de input não pode ser maior que 0. |
| > (AISP) Performance year rel max (0.0 -> OFF) | 0.0 | Se o patrimônio da conta estiver em $10.000 e o valor mínimo for definido como 0,15, o trading será suspenso se o patrimônio subir acima de $10.150. O valor será redefinido e o trading será reativado no início do próximo ano. O patrimônio no início do próximo período serve como novo valor de referência para calcular os limites de desempenho. O valor de input não pode ser menor que 0. |
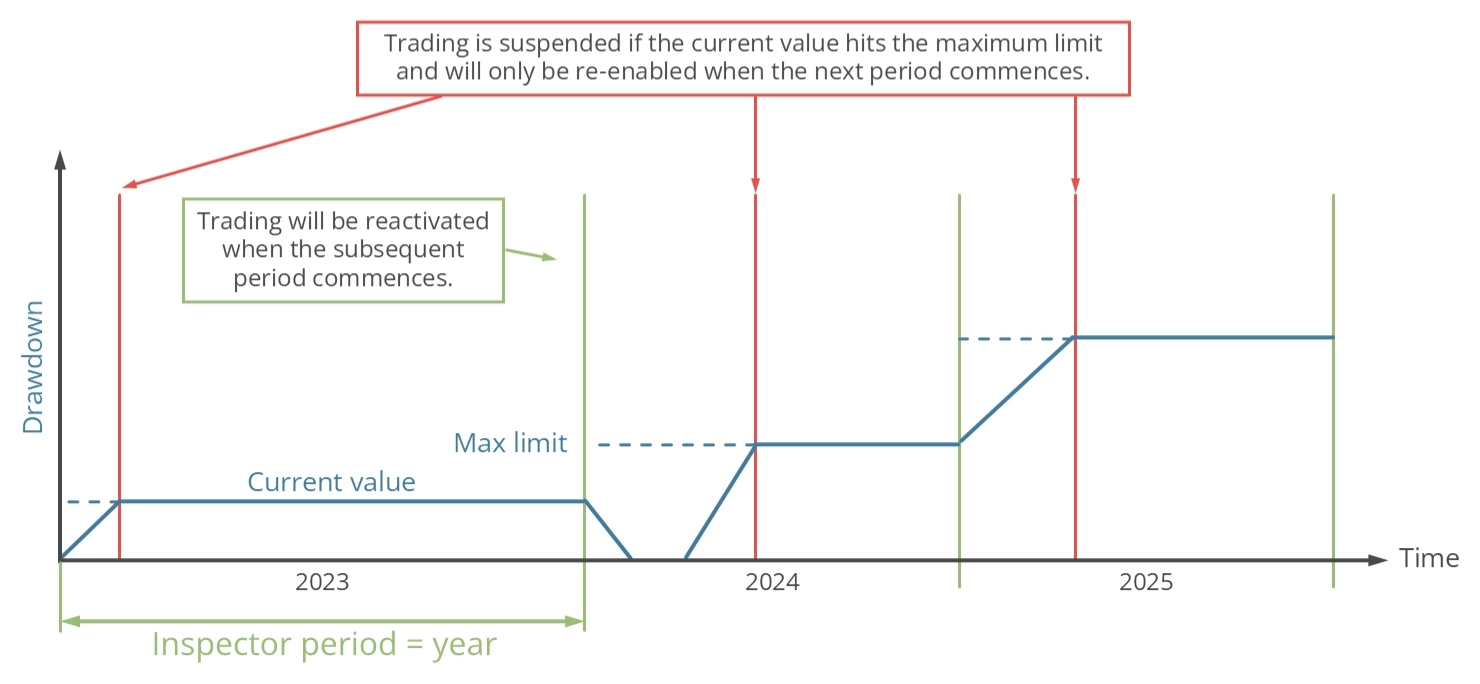
Existem parâmetros de input separados para os resultados de desempenho máximo e mínimo permitidos. Isso permite que o aplicativo suspenda a iniciação de novas operações quando resultados de desempenho positivos ou negativos forem alcançados. O diagrama abaixo elucida o princípio operacional da proteção anual do inspetor.
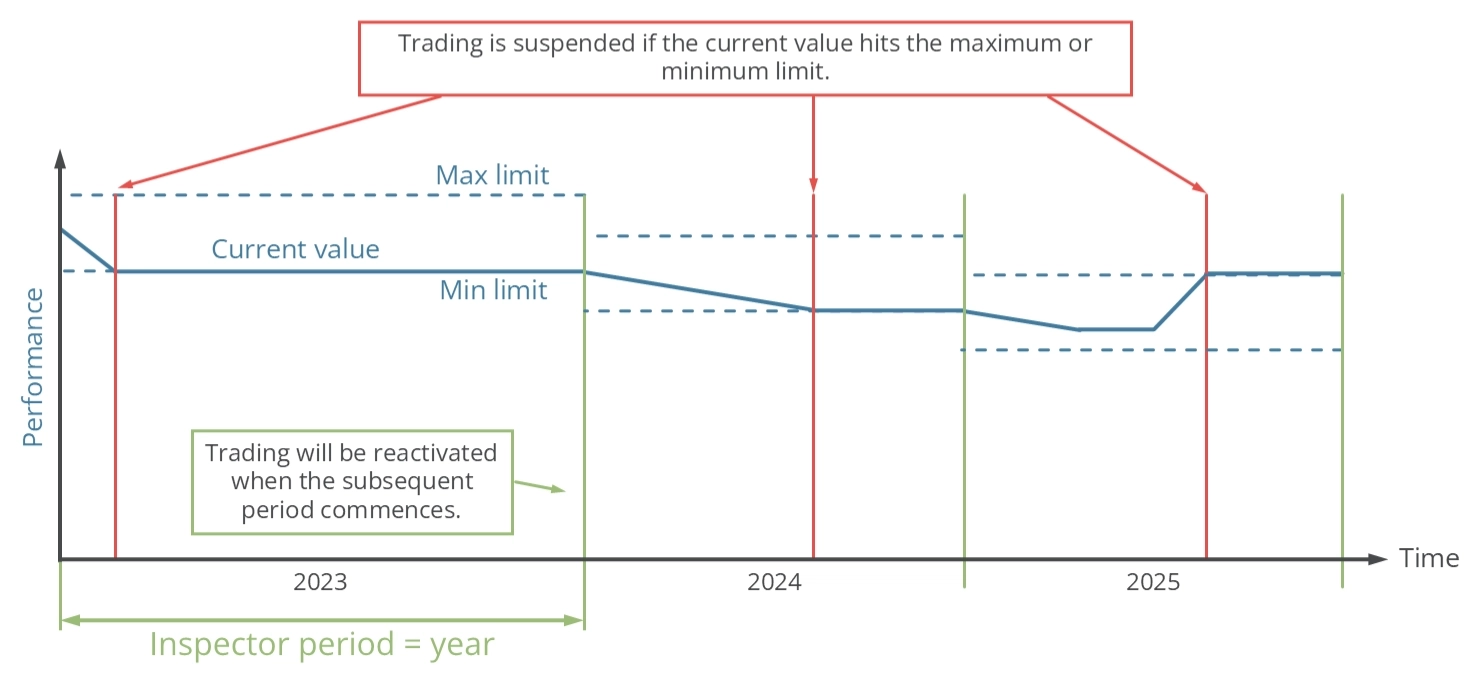
O período de inspeção é definido como um ano. Se o desempenho atingir o valor máximo ou mínimo dentro desse período, a capacidade de abrir novas operações será temporariamente suspensa. No início de um novo período, que neste caso é em 1º de janeiro, o valor de desempenho do ano é redefinido e o trading é retomado. Esse ciclo continua indefinidamente.
Desempenho - Proteção desde o início
O mecanismo de inspetor pode ser configurado para interromper o trading assim que um limite de desempenho especificado for atingido usando os parâmetros de input descritos na tabela abaixo. Esses parâmetros estabelecem os limites mínimos e máximos absolutos e relativos. Um valor zero desativa efetivamente o limite.
| Variável de input no MetaTrader | Valor padrão | Comentário |
|---|---|---|
| > (AISP) Performance since start abs min (0.0 -> OFF) | 0.0 | Se o patrimônio da conta estiver em $10.000 e o valor mínimo for definido como -100, o trading será suspenso se o patrimônio cair abaixo de $9.900. O valor de input não pode ser maior que 0. |
| > (AISP) Performance since start abs max (0.0 -> OFF) | 0.0 | Se o patrimônio da conta estiver em $10.000 e o valor mínimo for definido como 100, o trading será suspenso se o patrimônio subir acima de $10.100. O valor de input não pode ser menor que 0. |
| > (AISP) Performance since start rel min (0.0 -> OFF) | 0.0 | Se o patrimônio da conta estiver em $10.000 e o valor mínimo for definido como -0,15, o trading será suspenso se o patrimônio cair abaixo de $9.850. O valor de input não pode ser maior que 0. |
| > (AISP) Performance since start rel max (0.0 -> OFF) | 0.0 | Se o patrimônio da conta estiver em $10.000 e o valor mínimo for definido como 0,15, o trading será suspenso se o patrimônio subir acima de $10.150. O valor de input não pode ser menor que 0. |
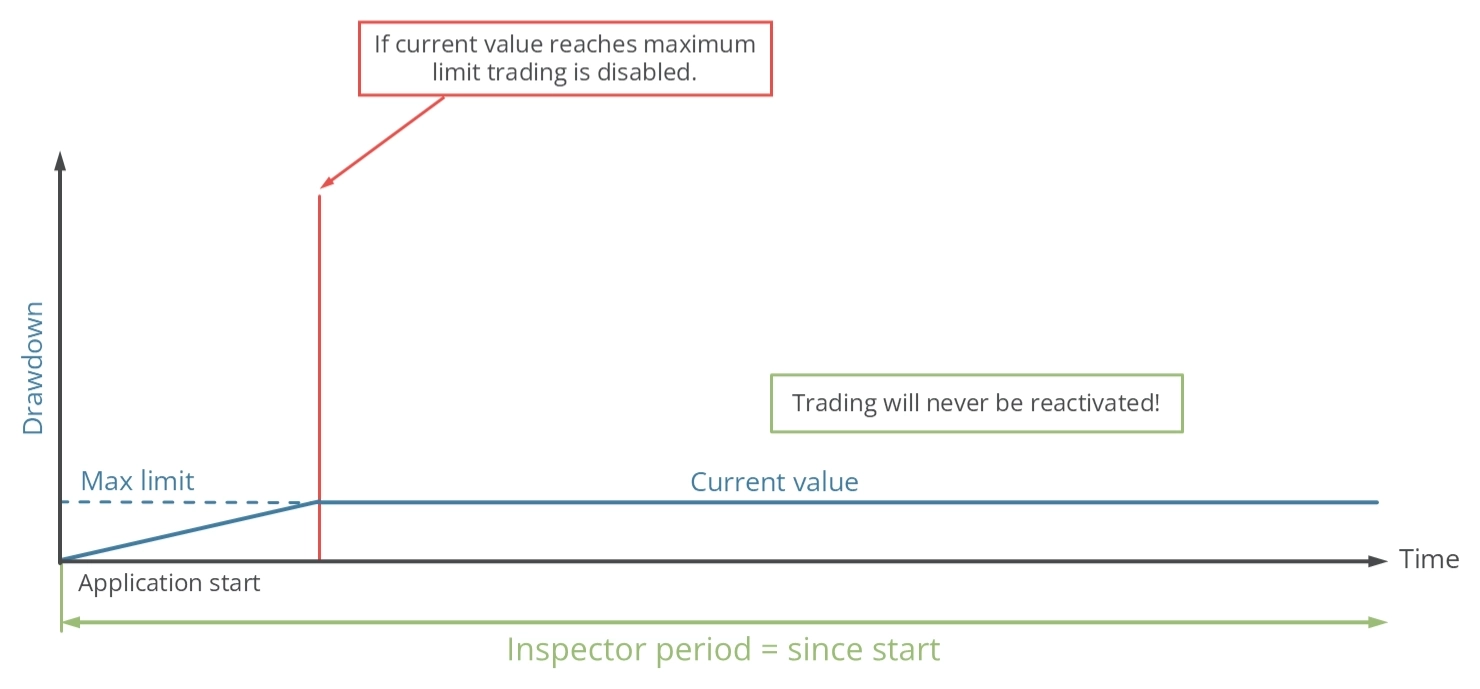
Existem parâmetros de input separados para os resultados de desempenho máximo e mínimo permitidos. Isso permite que o aplicativo suspenda a iniciação de novas operações quando resultados de desempenho positivos ou negativos forem alcançados. O diagrama abaixo elucida o princípio operacional da proteção do inspetor.
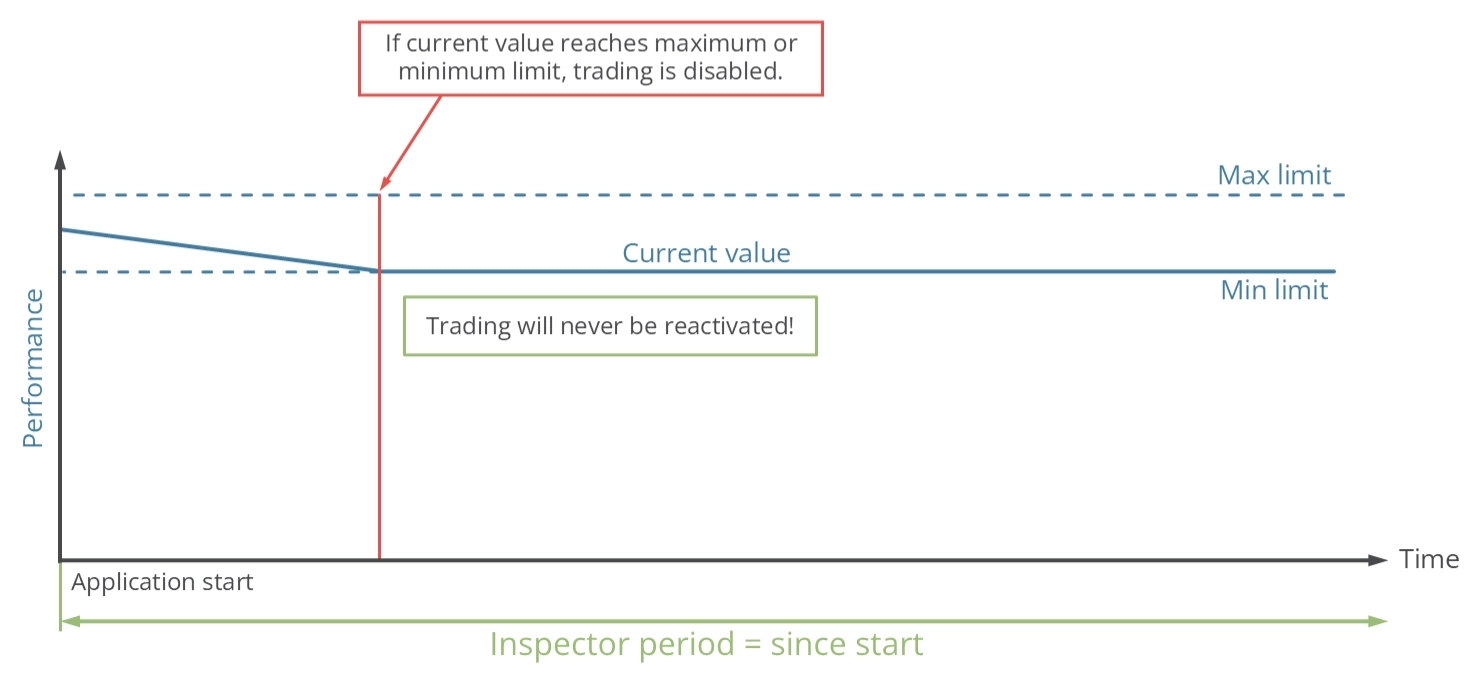
O período de inspeção começa quando o aplicativo é iniciado. Se o desempenho atingir o valor máximo ou mínimo, a capacidade de abrir novas operações será permanentemente suspensa.
Desempenho - Exemplo
Os gráficos abaixo fornecem exemplos de um sistema de trading com a) um desempenho máximo de -2% por dia e b) um desempenho de -2% desde que o aplicativo foi iniciado.
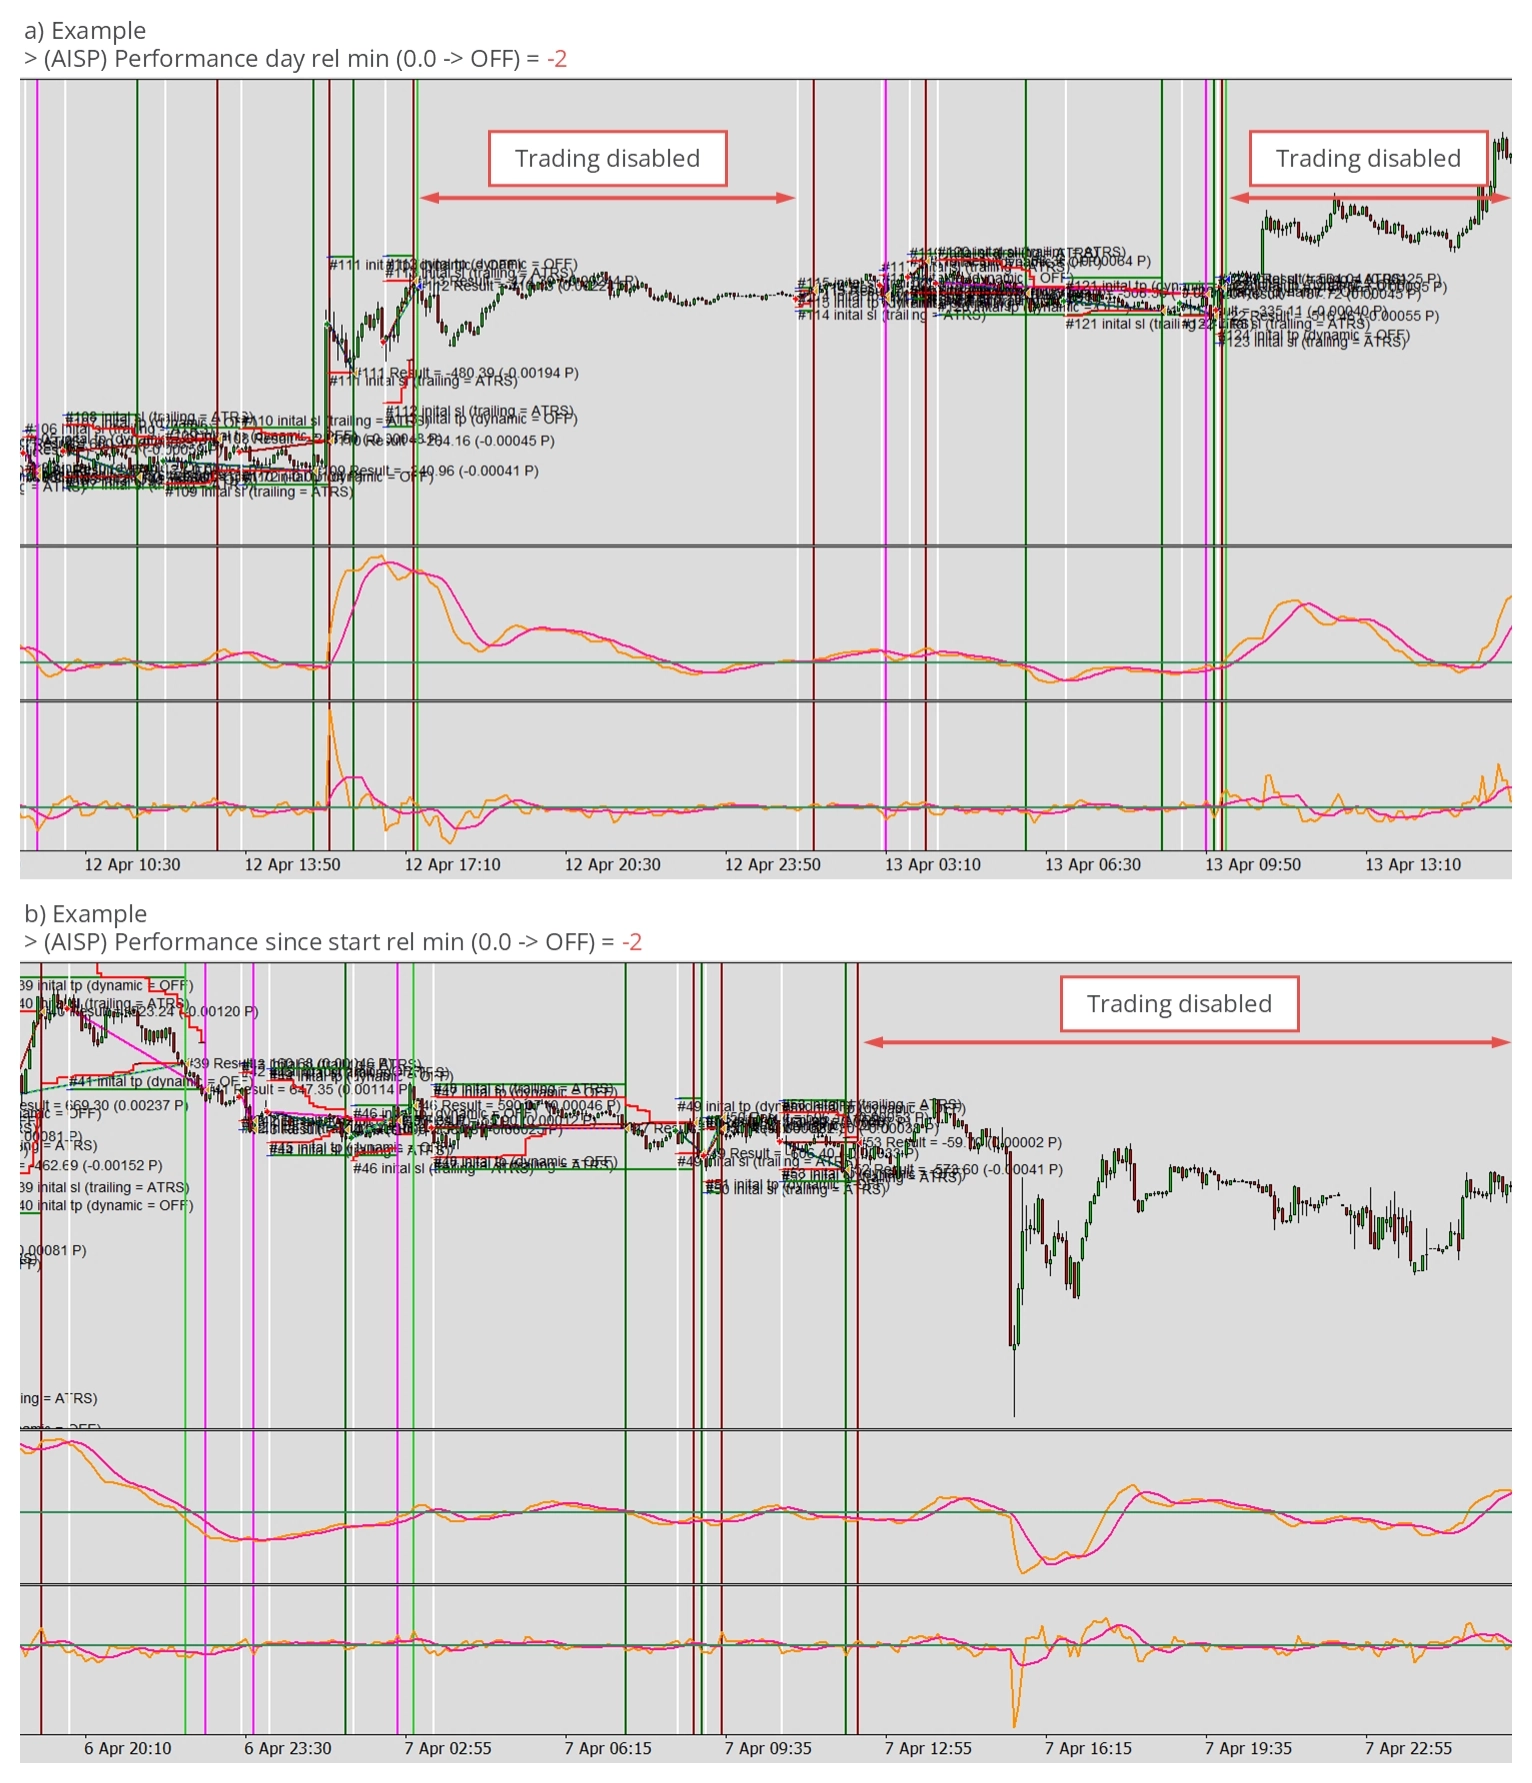
Em ambos os gráficos de exemplo, os módulos de trading param de abrir operações assim que o limite de desempenho de -2% é atingido. O gráfico b) mantém todos os módulos de trading desativados indefinidamente, enquanto o gráfico a) apenas desativa temporariamente o módulo de trading até o início do próximo dia. Como resultado, o gráfico a) contém dois períodos sem trading, pois o limite de -2% foi atingido em ambos os dias.
Drawdown - Proteção diária
O mecanismo de inspetor pode ser configurado para interromper o trading assim que um limite de drawdown diário especificado for atingido usando os parâmetros de input descritos na tabela abaixo. Esses parâmetros estabelecem os limites máximos absolutos e relativos diários. Um valor zero desativa efetivamente o limite.
| Variável de input no MetaTrader | Valor padrão | Comentário |
|---|---|---|
| > (AISP) Drawdown day abs max (0.0 -> OFF) | 0.0 | Se o patrimônio da conta estiver em $10.000 e o valor máximo for definido como 100, o trading será interrompido se o drawdown exceder $100 em um dia. O trading será retomado no início do próximo dia, com o patrimônio naquele momento usado como novo ponto de referência. O valor de input não pode ser menor que 0. |
| > (AISP) Drawdown day rel max (0.0 -> OFF) | 0.0 | Se o patrimônio da conta estiver em $10.000 e o valor máximo for definido como 0,15, o trading será interrompido se o drawdown exceder $150 em um dia. O trading será retomado no início do próximo dia, com o patrimônio inicial como ponto de referência. O novo valor de referência é usado para calcular os próximos limites de drawdown. O valor de input não pode ser menor que 0. |
Existem parâmetros de input para os resultados máximos de drawdown permitidos. Isso permite que o aplicativo suspenda a iniciação de novas operações quando valores de desempenho ruins forem superados. O diagrama abaixo elucida o princípio operacional da proteção diária do inspetor.
O período de inspeção é definido como um dia. Se o drawdown atingir o valor máximo dentro desse período, a capacidade de abrir novas operações será temporariamente suspensa. No início de um novo período, que é à meia-noite, o valor de drawdown do dia é redefinido e o trading é retomado. Esse ciclo continua indefinidamente.
Drawdown - Proteção semanal
O mecanismo de inspetor pode ser configurado para interromper o trading assim que um limite de drawdown semanal especificado for atingido usando os parâmetros de input descritos na tabela abaixo. Esses parâmetros estabelecem os limites máximos absolutos e relativos semanais. Um valor zero desativa efetivamente o limite.
| Variável de input no MetaTrader | Valor padrão | Comentário |
|---|---|---|
| > (AISP) Drawdown week abs max (0.0 -> OFF) | 0.0 | Se o patrimônio da conta estiver em $10.000 e o valor máximo for definido como 100, o trading será interrompido se o drawdown exceder $100 em uma semana. O trading será retomado no início da próxima semana, com o patrimônio naquele momento usado como novo ponto de referência. O valor de input não pode ser menor que 0. |
| > (AISP) Drawdown week rel max (0.0 -> OFF) | 0.0 | Se o patrimônio da conta estiver em $10.000 e o valor máximo for definido como 0,15, o trading será interrompido se o drawdown exceder $150 em uma semana. O trading será retomado no início da próxima semana, com o patrimônio inicial como ponto de referência. O novo valor de referência é usado para calcular os próximos limites de drawdown. O valor de input não pode ser menor que 0. |
Existem parâmetros de input para os resultados máximos de drawdown permitidos. Isso permite que o aplicativo suspenda a iniciação de novas operações quando valores de desempenho ruins forem superados. O diagrama abaixo elucida o princípio operacional da proteção diária do inspetor.
O período de inspeção é definido como uma semana. Se o drawdown atingir o valor máximo dentro desse período, a capacidade de abrir novas operações será temporariamente suspensa. No início de um novo período, que neste caso é à meia-noite entre sábado e domingo, o valor de drawdown do dia é redefinido e o trading é retomado. Esse ciclo continua indefinidamente.
Drawdown - Proteção mensal
O mecanismo de inspetor pode ser configurado para interromper o trading assim que um limite de drawdown mensal especificado for atingido usando os parâmetros de input descritos na tabela abaixo. Esses parâmetros estabelecem os limites máximos absolutos e relativos mensais. Um valor zero desativa efetivamente o limite.
| Variável de input no MetaTrader | Valor padrão | Comentário |
|---|---|---|
| > (AISP) Drawdown month abs max (0.0 -> OFF) | 0.0 | Se o patrimônio da conta estiver em $10.000 e o valor máximo for definido como 100, o trading será interrompido se o drawdown exceder $100 em um mês. O trading será retomado no início do próximo mês, com o patrimônio naquele momento usado como novo ponto de referência. O valor de input não pode ser menor que 0. |
| > (AISP) Drawdown month rel max (0.0 -> OFF) | 0.0 | Se o patrimônio da conta estiver em $10.000 e o valor máximo for definido como 0,15, o trading será interrompido se o drawdown exceder $150 em um mês. O trading será retomado no início do próximo mês, com o patrimônio inicial como ponto de referência. O novo valor de referência é usado para calcular os próximos limites de drawdown. O valor de input não pode ser menor que 0. |
Existem parâmetros de input para os resultados máximos de drawdown permitidos. Isso permite que o aplicativo suspenda a iniciação de novas operações quando valores de desempenho ruins forem superados. O diagrama abaixo elucida o princípio operacional da proteção diária do inspetor.
O período de inspeção é definido como um mês. Se o drawdown atingir o valor máximo dentro desse período, a capacidade de abrir novas operações será temporariamente suspensa. No início de um novo período, que é o 1º dia do mês, o valor de drawdown do dia é redefinido e o trading é retomado. Esse ciclo continua indefinidamente.
Drawdown - Proteção anual
O mecanismo de inspetor pode ser configurado para interromper o trading assim que um limite de drawdown anual especificado for atingido usando os parâmetros de input descritos na tabela abaixo. Esses parâmetros estabelecem os limites máximos absolutos e relativos anuais. Um valor zero desativa efetivamente o limite.
| Variável de input no MetaTrader | Valor padrão | Comentário |
|---|---|---|
| > (AISP) Drawdown year abs max (0.0 -> OFF) | 0.0 | Se o patrimônio da conta estiver em $10.000 e o valor máximo for definido como 100, o trading será interrompido se o drawdown exceder $100 em um ano. O trading será retomado no início do próximo ano, com o patrimônio naquele momento usado como novo ponto de referência. O valor de input não pode ser menor que 0. |
| > (AISP) Drawdown year rel max (0.0 -> OFF) | 0.0 | Se o patrimônio da conta estiver em $10.000 e o valor máximo for definido como 0,15, o trading será interrompido se o drawdown exceder $150 em um ano. O trading será retomado no início do próximo ano, com o patrimônio inicial como ponto de referência. O novo valor de referência é usado para calcular os próximos limites de drawdown. O valor de input não pode ser menor que 0. |
Existem parâmetros de input para os resultados máximos de drawdown permitidos. Isso permite que o aplicativo suspenda a iniciação de novas operações quando valores de desempenho ruins forem superados. O diagrama abaixo elucida o princípio operacional da proteção diária do inspetor.
O período de inspeção é definido como um ano. Se o drawdown atingir o valor máximo dentro desse período, a capacidade de abrir novas operações será temporariamente suspensa. No início de um novo período, que é em 1º de janeiro, o valor de drawdown do dia é redefinido e o trading é retomado. Esse ciclo continua indefinidamente.
Drawdown - Proteção desde o início
O mecanismo de inspetor pode ser configurado para interromper o trading assim que um limite de drawdown especificado for atingido usando os parâmetros de input descritos na tabela abaixo. Esses parâmetros estabelecem os limites máximos absolutos e relativos. Um valor zero desativa efetivamente o limite.
| Variável de input no MetaTrader | Valor padrão | Comentário |
|---|---|---|
| > (AISP) Drawdown since start abs max (0.0 -> OFF) | 0.0 | Se o patrimônio da conta estiver em $10.000 e o valor máximo for definido como 100, o trading será interrompido se o drawdown exceder $100. O valor de input não pode ser menor que 0. |
| > (AISP) Drawdown since start rel max (0.0 -> OFF) | 0.0 | Se o patrimônio da conta estiver em $10.000 e o valor máximo for definido como 0,15, o trading será interrompido se o drawdown exceder $150. O valor de input não pode ser menor que 0. |
Existem parâmetros de input para os resultados máximos de drawdown permitidos. Isso permite que o aplicativo suspenda a iniciação de novas operações quando valores de desempenho ruins forem superados. O diagrama abaixo elucida o princípio operacional da proteção diária do inspetor.
O período de inspeção começa quando o aplicativo é iniciado. Se o drawdown atingir o valor máximo, a capacidade de abrir novas operações será permanentemente suspensa.
Drawdown - Exemplo
Os gráficos abaixo fornecem exemplos de um sistema de trading com a) um drawdown máximo de -2% por dia e b) um drawdown de -2% desde que o aplicativo foi iniciado.
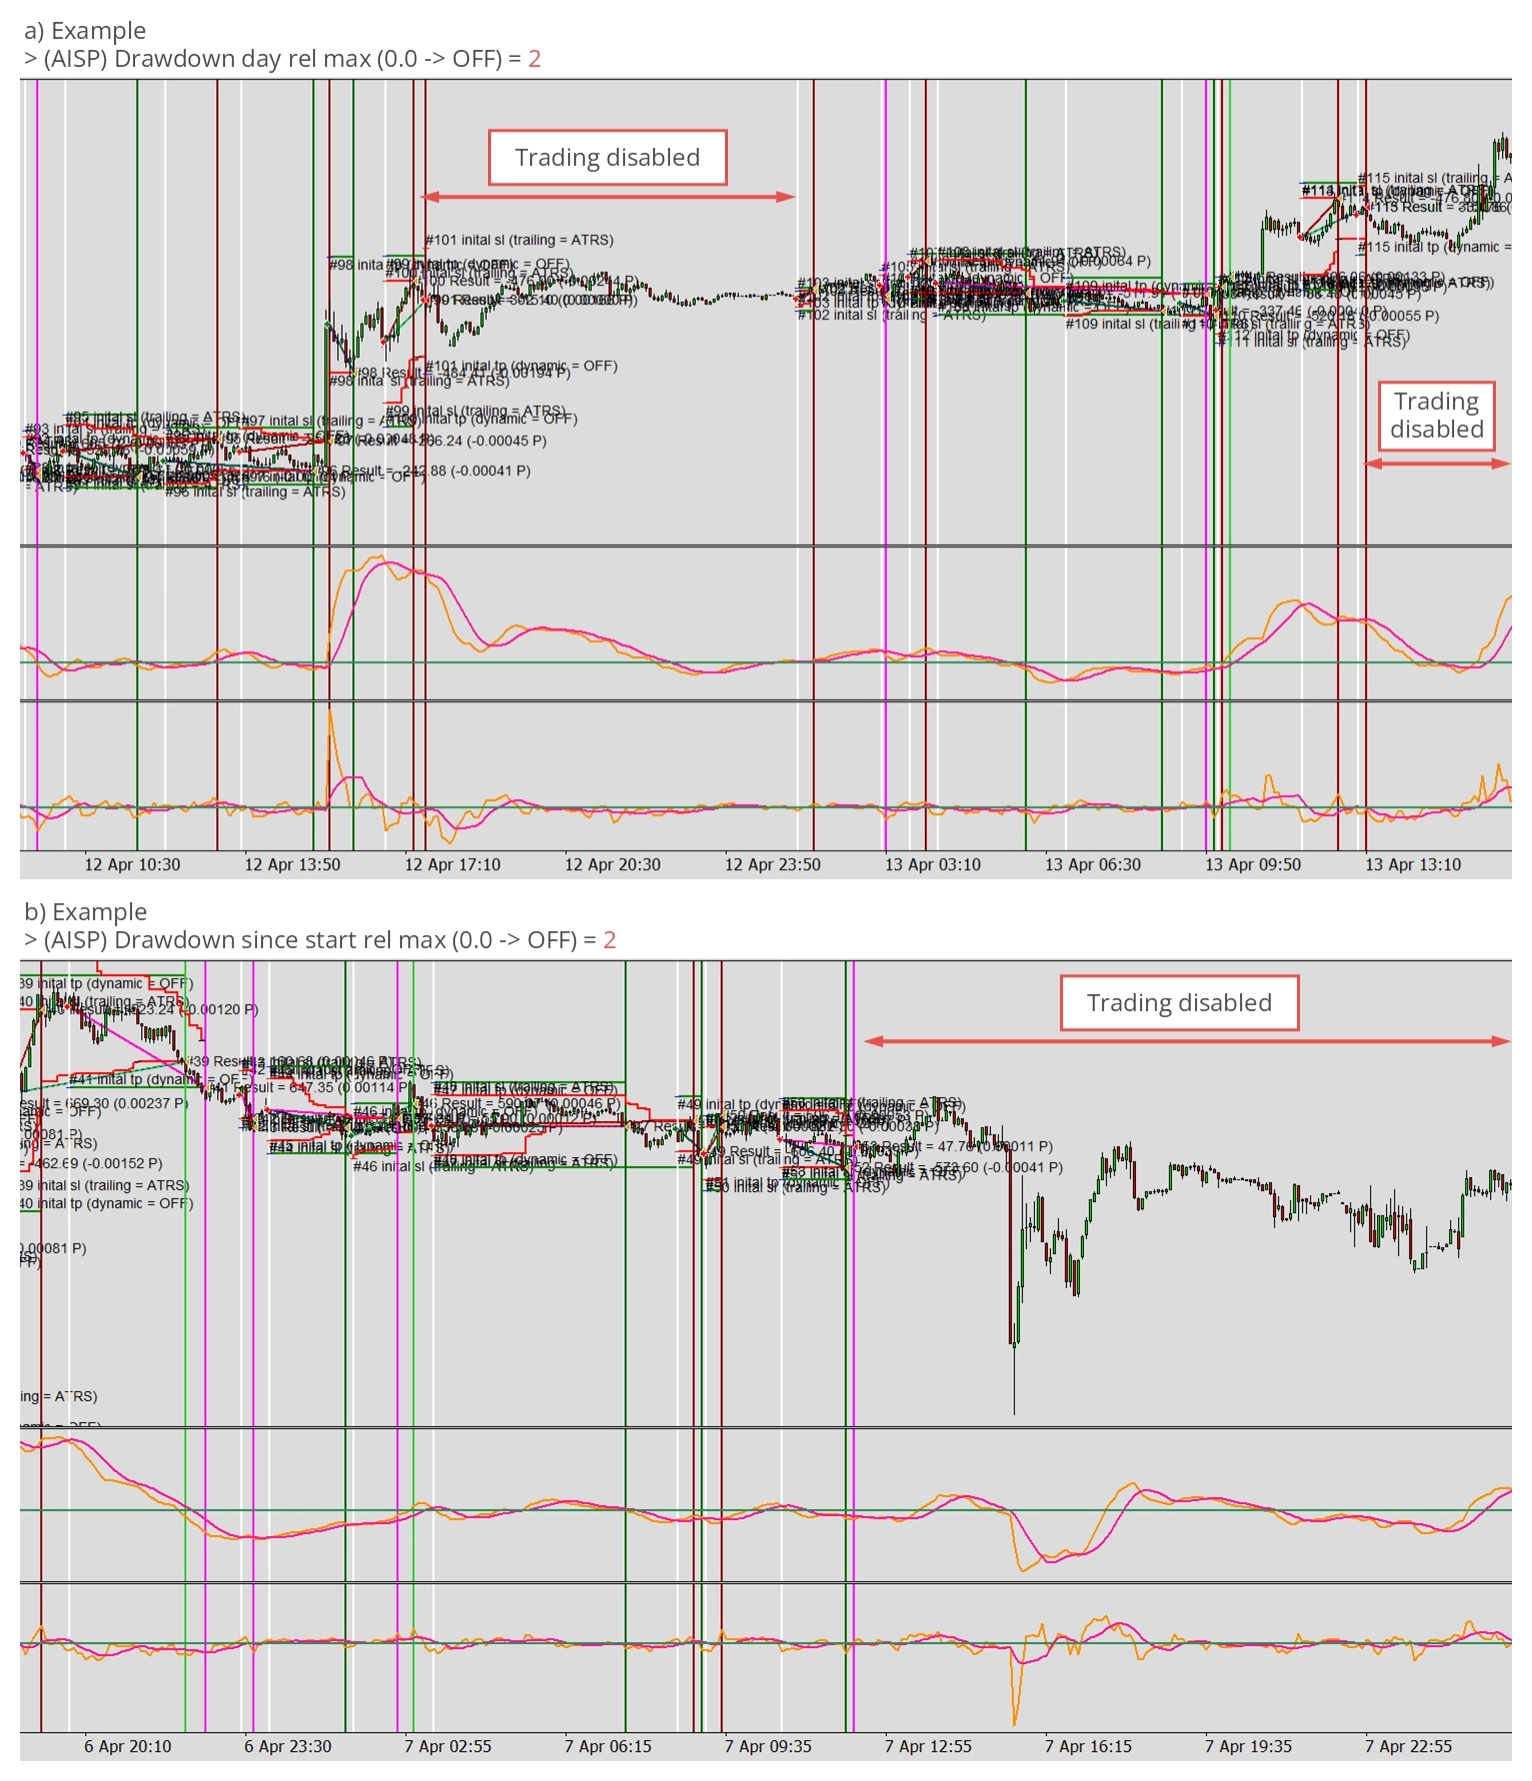
Em ambos os gráficos de exemplo, os módulos de trading param de abrir operações assim que o limite de drawdown de -2% é atingido. O gráfico b) mantém todos os módulos de trading desativados indefinidamente, enquanto o gráfico a) apenas desativa temporariamente o módulo de trading até o início do próximo dia. Como resultado, o gráfico a) contém dois períodos sem trading, pois o limite de -2% foi atingido em ambos os dias.
FIHA - Gerenciamento de arquivos
O Expert Advisor Builder lê continuamente os arquivos de módulo localizados na pasta Configuration. Dependendo do número de arquivos presentes, esse processo pode impactar o desempenho do sistema devido ao aumento das operações de acesso a arquivos. Embora algumas estratégias exijam atualizações frequentes, outras permanecem inalteradas assim que a execução começa. Para acomodar essas características variadas, o intervalo de leitura de arquivos pode ser ajustado usando os parâmetros listados abaixo.
| Variável de input no MetaTrader | Valor padrão | Comentário |
|---|---|---|
| > (FIHA) Live, Configuration files reading interval (ms) | 1000 | Especifica o intervalo de leitura de arquivos quando o sistema está operando em um gráfico ao vivo. |
| > (FIHA) Tester, Configuration files reading interval (ms) | 86400000 | Especifica o intervalo de leitura de arquivos quando o sistema é executado no strategy tester. A configuração padrão corresponde a um dia simulado. |
No modo Strategy Tester, usar o segundo parâmetro permite aumentar a velocidade de execução, possibilitando que mais testes sejam realizados em um período mais curto.
NOTI - Notificações
Ativação e desativação de notificações
Ao operar o Expert Advisor Builder em um gráfico ao vivo, ele pode fornecer atualizações sobre os limites do inspetor atingidos e vários relatórios sobre seu desempenho mais recente e métricas de drawdown. Essas mensagens podem ser exibidas na aba experts do MetaTrader ou enviadas como e-mails por meio da API de e-mails integrada do MetaTrader. Se você deseja modificar as mensagens que receberá, pode ajustar os seguintes parâmetros de input.
| Variável de input no MetaTrader | Valor padrão | Comentário |
|---|---|---|
| > (NOTI) Protection | ON | Opções: -OFF -ON |
| > (NOTI) Report daily | ON | Opções: -OFF -ON |
| > (NOTI) Report weekly | OFF | Opções: -OFF -ON |
| > (NOTI) Report monthly | ON | Opções: -OFF -ON |
| > (NOTI) Report end | OFF | Opções: -OFF -ON |
Tipos de notificações e configuração do MetaTrader
Os parâmetros de input discutidos até agora determinam as informações enviadas a você. Em contraste, os seguintes parâmetros definem como essas informações serão entregues.
| Variável de input no MetaTrader | Valor padrão | Comentário |
|---|---|---|
| > (NOTI) State logs | OFF | Opções: -OFF -ON |
| > (NOTI) State mails | OFF | Opções: -OFF -ON |
O Expert Advisor Builder pode transmitir informações pela aba experts na visão do terminal do MetaTrader e por e-mail. A primeira opção, que pode ser ativada com o parâmetro de input > (NOTI) State logs, funciona tanto com as variantes do testador quanto ao vivo do Expert Advisor Builder. A segunda opção > (NOTI) State mails permite que o Expert Advisor Builder envie e-mails com as mesmas informações, disponível apenas com a variante ao vivo.
Por padrão, ambas as opções estão desativadas. O Expert Advisor Builder não enviará nem registrará relatórios estendidos.
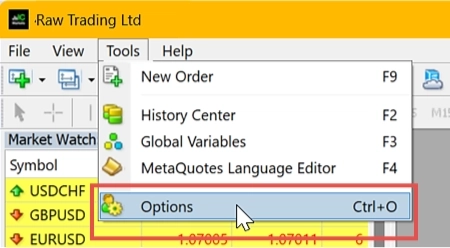
Este recurso utiliza a API de e-mail integrada do MetaTrader para transmitir as informações. No entanto, requer a configuração das definições de e-mail na sua instância do MetaTrader. Essas configurações podem ser encontradas no menu Tools - Options do seu MetaTrader.
Para notificações por e-mail, você pode definir as configurações na aba Email.
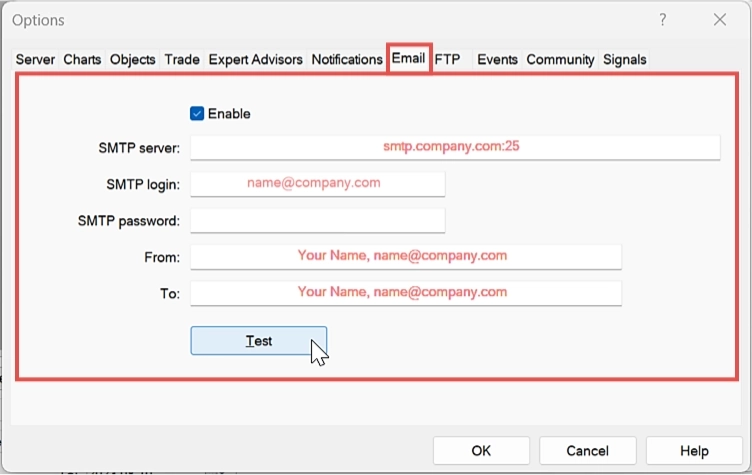
Consulte o artigo relevante para uma compreensão detalhada dos parâmetros necessários para ativar esses recursos.
PAOV - Substituição de parâmetros
Usando os parâmetros deste grupo de input, você pode substituir linhas de parâmetros dos arquivos de módulo carregados. As substituições podem ser aplicadas globalmente, afetando todos os arquivos de módulo de uma vez, ou seletivamente a um ou mais módulos específicos. Essa funcionalidade é particularmente útil para aproveitar ao máximo o recurso de otimização do MetaTrader, pois permite otimizar parâmetros de arquivos de módulo mesmo que não estejam expostos no diálogo de propriedades do expert.
Você pode definir até 20 parâmetros e seus valores correspondentes. Para simplificar, a tabela abaixo mostra apenas um exemplo; os 19 inputs restantes se comportam de forma idêntica.
| Variável de input no MetaTrader | Valor padrão | Comentário |
|---|---|---|
| > (PAOV) Override 1: Selection | Especifica o parâmetro e a seleção do módulo usando o formato parameter@modules. Múltiplos parâmetros e módulos podem ser selecionados para substituição. Se uma linha no arquivo de módulo carregado corresponder à seleção especificada, seu valor será substituído pelo valor definido na linha subsequente. | |
| > (PAOV) Override 1: Value | 0.0 | Insira o valor de substituição diretamente ou use as configurações de otimização do MetaTrader para testar um intervalo de valores. |
| > (PAOV) Override X: Selection | O mesmo princípio se aplica aos parâmetros 2 a 20. | |
| > (PAOV) Override X: Value |
Para entender completamente este recurso, revise os exemplos fornecidos para > (PAOV) Override 1: Selection:
- INOS_1_dParameter1@ALL - Substituição de parâmetro único aplicada a todos os módulos.
- INOS_1_dParameter1@100,300 - Substituição de parâmetro único aplicada aos módulos específicos com os números 100 e 300.
- dParameter1@ALL - Aplicada a todos os parâmetros que contêm o nome do parâmetro e para todos os módulos.
- dParameter1@100,300 - Aplicada a todos os parâmetros que contêm o nome do parâmetro e usados para módulos com os números 100 e 300.
- INOS_1_dParameter1@100;INOS_4_dParameter1@300 - Aplicada a múltiplos parâmetros com diferentes atribuições de módulo.
- dParameter1,dParameter2@100,200,300;dParameter3@400: Aplicada a múltiplos parâmetros com diferentes atribuições de módulo.
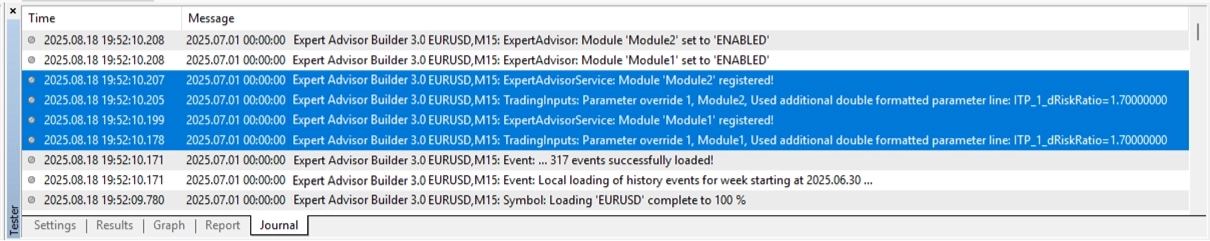
Se a substituição for bem-sucedida, seu status será exibido na janela de log. Ao usar o Strategy Tester do MetaTrader 4, essas informações aparecerão na aba Journal:
Exemplos padrão
Usando um exemplo
Passo 1: Abra o aplicativo web Expert Advisor Builder
Todos os exemplos estão prontamente acessíveis dentro do Expert Advisor Builder. Basta abrir o aplicativo web e inserir qualquer exemplo conforme necessário.
Passo 2: Abra o menu de Exemplos
No lado esquerdo da janela principal, clique em Add example module. Isso abre um diálogo exibindo uma lista de módulos de exemplo pré-criados. Cada exemplo inclui uma breve descrição, seus parâmetros de configuração e uma imagem de gráfico de amostra mostrando o resultado esperado.
Passo 3: Escolha um exemplo da lista
Selecione um dos exemplos no menu suspenso. Como você notará, os nomes listados ali correspondem aos da tabela mais abaixo na página.
Passo 4: Importe o módulo selecionado e revise sua configuração
Por fim, conclua a importação clicando em Add Example Module. Isso cria um novo módulo de trading com todas as configurações já definidas de acordo com a descrição do exemplo.
Visão geral dos exemplos
Estratégias de trading de exemplo
| Nome | Observação | Descrição |
|---|---|---|
| Example A1 | MACD Long trading | Link |
| Example A2 | MACD Short trading | Link |
| Example A3 | Bollinger bands trading | Link |
| Example A4 | News trading de eventos de calendário de alto impacto | Link |
| Example A5 | News trading de eventos de calendário regionais de alto impacto | Link |
| Example A6 | Evitando eventos de calendário de alto impacto | Link |
| Example A7 | Um analisador de gráficos para geração de sinais | Link |
Temporização
| Nome | Observação | Descrição |
|---|---|---|
| Example B1 | Trading em horários específicos | Link |
| Example B2 | Trading em dias específicos da semana | Link |
| Example B3 | Trading em dias específicos do mês | Link |
| Example B4 | Modo de trading intradiário com fechamentos forçados no fim do dia | Link |
| Example B5 | Deslocamento automático de sinais conforme o horário de verão (DST) | Link |
Trailing de Stop Loss
| Nome | Observação | Descrição |
|---|---|---|
| Example C1 | Trailing de Stop Loss por average true range | Link |
| Example C2 | Primeiro breakeven, depois trailing de Stop Loss por average true range | Link |
| Example C3 | Primeiro breakeven, depois average true range, depois trailing de Stop Loss de mercado | Link |
Stop Loss inicial e Take Profit inicial
| Nome | Observação | Descrição |
|---|---|---|
| Example D1 | Distância fixa em pips como Stop Loss inicial e Take Profit inicial | Link |
| Example D2 | Valor de indicador para Stop Loss inicial e Take Profit inicial | Link |
| Example D3 | Valor de indicador para Stop Loss inicial, trailing de Stop Loss, Take Profit inicial e Take Profit dinâmico | Link |
| Example D4 | Suporte e resistência para Stop Loss inicial e Take Profit inicial | Link |
| Example D5 | Suporte e resistência para Stop Loss inicial, trailing de Stop Loss, Take Profit inicial e Take Profit dinâmico | Link |
| Example D6 | Busca por padrões de velas usada para Stop Loss inicial e Take Profit inicial | Link |
| Example D7 | Busca por padrões de gráficos usada para Stop Loss inicial e Take Profit inicial | Link |
| Example D8 | Busca por padrões de Fibonacci usada para Stop Loss inicial e Take Profit inicial | Link |
Divisão de operações
| Nome | Observação | Descrição |
|---|---|---|
| Example E1 | Duas operações com uma ordem pendente | Link |
| Example E2 | Três operações | Link |
| Example E3 | Quatro operações | Link |
Monitoramento de desempenho e drawdown
| Nome | Observação | Descrição |
|---|---|---|
| Example F1 | Desativação temporária do trading por mau desempenho | Link |
| Example F2 | Desativação permanente do trading por mau desempenho | Link |
| Example F3 | Desativação temporária do trading por drawdown excessivo | Link |
| Example F4 | Desativação permanente do trading por drawdown excessivo | Link |
Ordens pendentes
| Nome | Observação | Descrição |
|---|---|---|
| Example G1 | Buy stop e preço pendente com StdDev | Link |
| Example G2 | Buy limit e preço pendente com StdDev | Link |
| Example G3 | Sell stop e preço pendente com StdDev | Link |
| Example G4 | Sell limit e preço pendente com StdDev | Link |
| Example G5 | Buy stop e preço pendente por taxa de variação | Link |
| Example G6 | Buy stop e valor de indicador para preço pendente | Link |
| Example G7 | Buy stop e suporte e resistência para preço pendente | Link |
| Example G8 | Buy stop e ativação dependente de preço (histerese mín) | Link |
| Example G9 | Buy stop e cancelamento dependente de preço (histerese máx) | Link |
News trading
| Nome | Observação | Descrição |
|---|---|---|
| Example H1 | Eventos filtrados por título | Link |
| Example H2 | Eventos filtrados por relação | Link |
Indicadores
| Nome | Observação | Descrição |
|---|---|---|
| Example I1 | Uma linha de indicador utilizada | Link |
| Example I2 | Uma linha de indicador com exclusão de tempo utilizada | Link |
| Example I3 | Duas linhas de indicador combinadas | Link |
| Example I4 | Quatro linhas de indicador combinadas | Link |
| Example I5 | Usando preço como indicador | Link |
Osciladores
| Nome | Observação | Descrição |
|---|---|---|
| Example J1 | Uma linha de oscilador usada como sinal | Link |
| Example J2 | Duas linhas de oscilador combinadas como sinal | Link |
| Example J3 | Usando volume como oscilador | Link |
Trade Basics
| Nome | Observação | Descrição |
|---|---|---|
| Example K1 | Múltiplas operações abertas permitidas | Link |
| Example K2 | Sinais usados para abertura e fechamento de operações | Link |
| Example K3 | Combinação de sinais com lógica OU | Link |
| Example K4 | Tempo de espera forçado entre operações | Link |
Visualização de sinais
| Nome | Observação | Descrição |
|---|---|---|
| Example L1 | Apenas sinal MACD Long | Link |
| Example L2 | Apenas sinal MACD Short | Link |
Cálculo de volume
| Nome | Observação | Descrição |
|---|---|---|
| Example M1 | Valor de indicador para cálculo de volume com indicador externo | Link |
Motores de busca
| Nome | Observação | Descrição |
|---|---|---|
| Example N1 | Sinais não operados gerados por busca de velas | Link |
| Example N2 | Sinais não operados gerados por busca de padrões | Link |
| Example N3 | Sinais não operados gerados por busca de Fibonacci | Link |
Analisador de gráficos
| Nome | Observação | Descrição |
|---|---|---|
| Example O1 | Análise estendida de swings | Link |
| Example O2 | Desenho do painel do analisador de gráficos | Link |
| Example O3 | Exclusão de suporte e resistência no encaminhamento | Link |
| Example O4 | Dois analisadores de gráficos para geração de sinais | Link |
Feedback de dados
| Nome | Observação | Descrição |
|---|---|---|
| Example P1 | Todos os recursos de feedback ativados | Link |
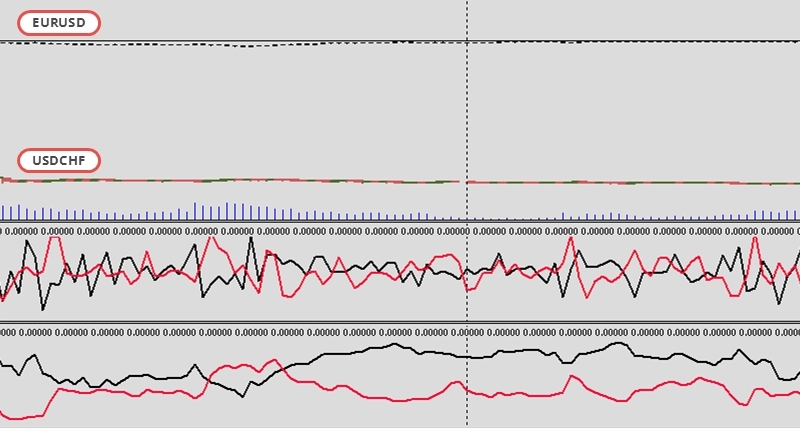
Trading com múltiplos símbolos
| Nome | Observação | Descrição |
|---|---|---|
| Example Q1 | Mapeamento de símbolos para símbolos personalizados | Link |
| Example Q2 | Uso de múltiplos símbolos e feedback de símbolo (EURUSD e USDCHF) | Link |
| Example Q3 | Coeficiente de correlação entre dois símbolos (EURUSD e USDCHF) | Link |
Integração com script Python externo
| Nome | Observação | Descrição |
|---|---|---|
| Example R1 | Sinal de oscilador personalizado e script Python externo | Link |
| Example R2 | Encaminhamento de parâmetros e análise de feedback com indicador personalizado e script Python externo | Link |
Outros
| Nome | Observação | Descrição |
|---|---|---|
| Example S1 | Desenho de segundo timeframe no gráfico | Link |
| Example S2 | Desenho de símbolos distintos | Link |
Lista de exemplos
Exemplo A1: MACD Long trading
CAUTION
Esta não é uma estratégia de trading pronta para uso. Uma estratégia de trading requer ajuste do timeframe e do símbolo, além de backtesting rigoroso. O exemplo é destinado como base para sua própria estratégia personalizada e para ajudá-lo a se familiarizar com a aplicação web Expert Advisor Builder. Para importar e usar um exemplo, siga as instruções fornecidas aqui.
Descrição
Este exemplo demonstra uma estratégia fundamental de Long trading usando o indicador MACD (Moving Average Convergence Divergence). A estratégia abre posições de compra quando a linha principal do MACD cruza acima da linha de sinal, indicando potencial momento ascendente. O indicador de Desvio Padrão calcula o Stop Loss inicial, proporcionando gestão de risco dinâmica baseada na volatilidade do mercado.
O sistema usa um risk ratio de 1,40 para o nível de Take Profit, o que significa que o alvo de lucro potencial é 40% maior do que o risco assumido. Isso cria um equilíbrio favorável de risco/recompensa para a lucratividade a longo prazo. O recurso de ajuste de encaminhamento ajuda a posicionar o Stop Loss a uma distância adequada do preço de entrada, evitando saídas prematuras durante flutuações normais do mercado.
Esta configuração funciona bem em diferentes timeframes e pares de moedas. Iniciantes podem usar este exemplo para entender como os indicadores técnicos geram sinais de trading e como a gestão de risco adequada protege o capital enquanto permite que os lucros se desenvolvam.
Reproduzir o exemplo
Você pode importar este exemplo diretamente ou configurá-lo manualmente. Para replicar manualmente o módulo de trading, certifique-se de que o módulo recém-adicionado inclua as seguintes configurações principais e que o modo profissional esteja ativado:
Trade Basics
- Operation type = Long
Signal Generation - Indicators - STD
- Signal in use = On
- Signal used for = Forward
- Selected indicator = STD
- Draw in chart = Off
- Forward adjustment = 3.50
Signal Generation - Indicators (MACD Main line)
- Signal in use = On
- Signal used for = Entry
- Selected indicator = MACD
- Line index = Main line
- Draw in chart = On
- Drawing slot = 1
Signal Generation - Indicators (MACD Signal line)
- Signal in use = On
- Signal used for = Entry
- Selected indicator = MACD
- Line index = Signal line
- Draw in chart = On
- Drawing slot = 2
Signal Generation - Indicator Combinations (MACD Main line & MACD Signal line)
- Signal in use = On
- Signal used for = Entry
- Input indicator 1 = MACD (Main line)
- Input indicator 2 = MACD (Signal line)
- Value relation = Value 1 cross value 2
Initial Stop Loss
- Selection = Indicator
- Used indicator = STD
Initial Take Profit
- Selection = Risk ratio
- Risk ratio = 1.40
Capturas de tela
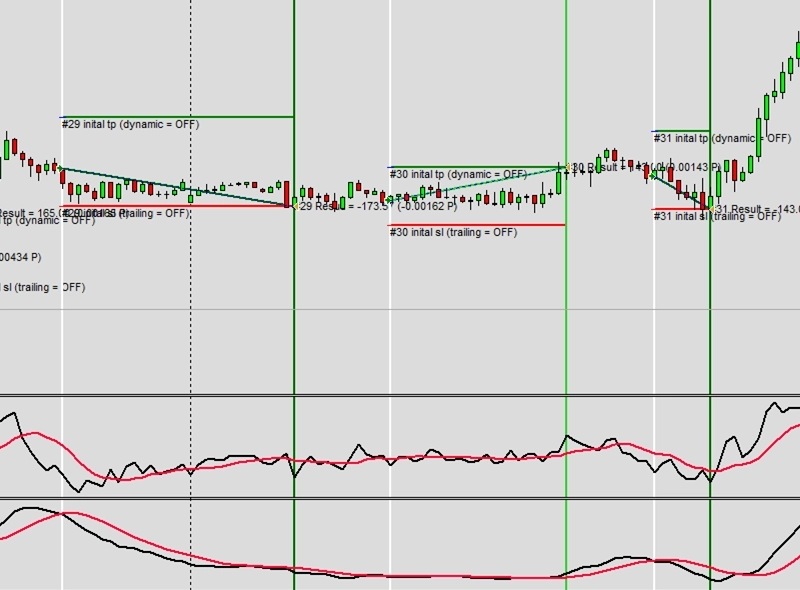
Exemplo A2: MACD Short trading
CAUTION
Esta não é uma estratégia de trading pronta para uso. Uma estratégia de trading requer ajuste do timeframe e do símbolo, além de backtesting rigoroso. O exemplo é destinado como base para sua própria estratégia personalizada e para ajudá-lo a se familiarizar com a aplicação web Expert Advisor Builder. Para importar e usar um exemplo, siga as instruções fornecidas aqui.
Descrição
Este exemplo apresenta uma estratégia de Short trading que espelha a abordagem Long do MACD, mas opera na direção oposta. A estratégia abre posições de venda quando a linha de sinal do MACD cruza acima da linha principal, sugerindo movimento de preço descendente. Essa inversão da condição de cruzamento adapta o indicador para condições de mercado de baixa.
Semelhante à versão long, o indicador de Desvio Padrão gerencia o risco determinando o posicionamento do Stop Loss com um ajuste de encaminhamento de 3,50. O Take Profit usa o mesmo risk ratio de 1,40, mantendo princípios consistentes de risco/recompensa independentemente da direção da operação.
O Short trading requer atenção cuidadosa às condições de mercado, pois muitos ativos têm viés ascendente ao longo do tempo. Este exemplo ajuda os traders a entender como os mesmos indicadores podem gerar sinais opostos ajustando as condições de relação entre as linhas do indicador.
Reproduzir o exemplo
Você pode importar este exemplo diretamente ou configurá-lo manualmente. Para replicar manualmente o módulo de trading, certifique-se de que um módulo recém-adicionado inclua as seguintes configurações principais e que o modo profissional esteja ativado:
Trade Basics
- Operation type = Short
Signal Generation - Indicators - STD
- Signal in use = On
- Signal used for = Forward
- Selected indicator = STD
- Draw in chart = Off
- Forward adjustment = 3.50
Signal Generation - Indicators (MACD Main line)
- Signal in use = On
- Signal used for = Entry
- Selected indicator = MACD
- Line index = Main line
- Draw in chart = On
- Drawing slot = 1
Signal Generation - Indicators (MACD Signal line)
- Signal in use = On
- Signal used for = Entry
- Selected indicator = MACD
- Line index = Signal line
- Draw in chart = On
- Drawing slot = 2
Signal Generation - Indicator Combinations (MACD Main line & MACD Signal line)
- Signal in use = On
- Signal used for = Entry
- Input indicator 1 = MACD (Main line)
- Input indicator 2 = MACD (Signal line)
- Value relation = Value 2 cross value 1
Initial Stop Loss
- Selection = Indicator
- Used indicator = STD
Initial Take Profit
- Selection = Risk ratio
- Risk ratio = 1.40
Capturas de tela
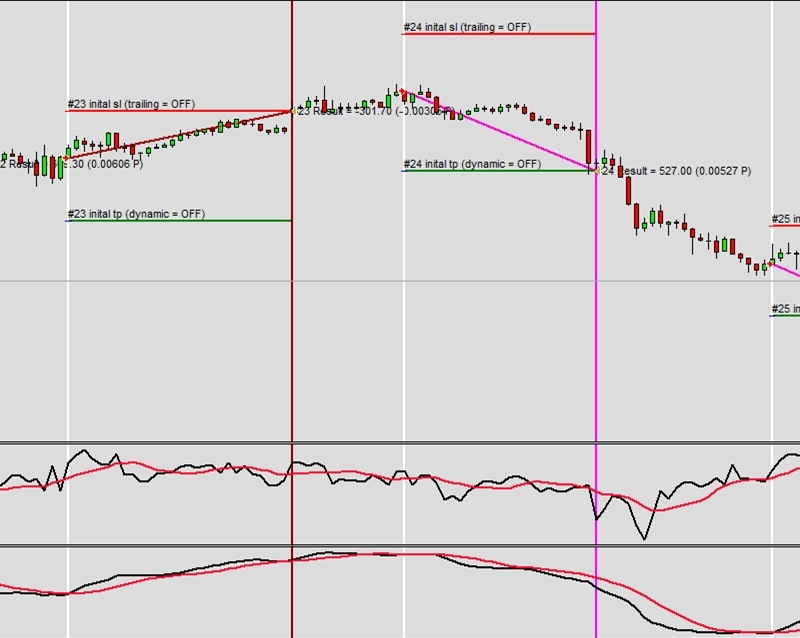
Exemplo A3: Bollinger bands trading
CAUTION
Esta não é uma estratégia de trading pronta para uso. Uma estratégia de trading requer ajuste do timeframe e do símbolo, além de backtesting rigoroso. O exemplo é destinado como base para sua própria estratégia personalizada e para ajudá-lo a se familiarizar com a aplicação web Expert Advisor Builder. Para importar e usar um exemplo, siga as instruções fornecidas aqui.
Descrição
Este exemplo apresenta o trading com Bollinger Bands, uma estratégia popular que identifica pontos de entrada potenciais quando o preço rompe os limites estatísticos. O sistema gera sinais long quando o preço de abertura cruza abaixo da Bollinger Band inferior, sugerindo uma condição de sobrevenda que pode reverter para cima. Todas as três linhas das Bollinger Bands são exibidas no gráfico para confirmação visual.
A estratégia usa um Stop Loss fixo de 100 pips. O Take Profit mantém o risk ratio padrão de 1,40, visando 140 pips de lucro. Essa abordagem fixa funciona particularmente bem em mercados de range, onde o preço tende a saltar entre as bandas.
As Bollinger Bands se adaptam automaticamente à volatilidade do mercado, alargando-se durante períodos voláteis e estreitando-se durante mercados calmos. Essa natureza autoadaptável torna a estratégia adequada para várias condições de mercado.
Reproduzir o exemplo
Você pode importar este exemplo diretamente ou configurá-lo manualmente. Para replicar manualmente o módulo de trading, certifique-se de que um módulo recém-adicionado inclua as seguintes configurações principais e que o modo profissional esteja ativado:
Trade Basics
- Operation type = Long
Signal Generation - Indicators (BB Main)
- Signal in use = On
- Signal used for = Forward
- Selected indicator = BB
- Line index = Main
- Draw in chart = On
- Drawing slot = 1
Signal Generation - Indicators (BB Upper)
- Signal in use = On
- Signal used for = Forward
- Selected indicator = BB
- Line index = Upper
- Draw in chart = On
- Drawing slot = 2
Signal Generation - Indicators (BB Lower)
- Signal in use = On
- Signal used for = Forward
- Selected indicator = BB
- Line index = Lower
- Draw in chart = On
- Drawing slot = 3
Signal Generation - Indicators (PRICE)
- Signal in use = On
- Signal used for = Entry
- Selected indicator = PRICE
- Series = Open
- Draw in chart = On
- Drawing slot = 4
Signal Generation - Indicator Combinations (PRICE Open & BB Lower)
- Signal in use = On
- Signal used for = Entry
- Input indicator 1 = PRICE (Open)
- Input indicator 2 = BB (Lower)
- Value relation = Value 2 cross value 1
Initial Stop Loss
- Selection = Rate of change
- Rate change = 0.00100000
Initial Take Profit
- Selection = Risk ratio
- Risk ratio = 1.40
Capturas de tela
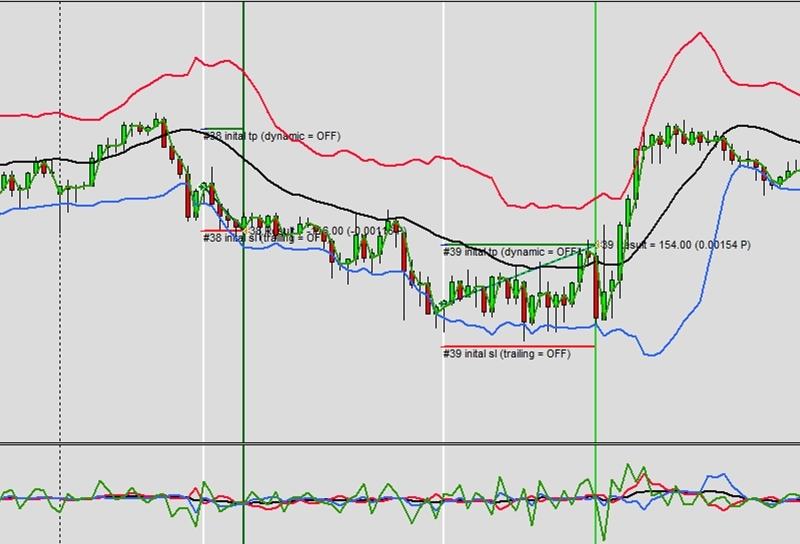
Exemplo A4: News trading de eventos de calendário de alto impacto
CAUTION
Esta não é uma estratégia de trading pronta para uso. Uma estratégia de trading requer ajuste do timeframe e do símbolo, além de backtesting rigoroso. O exemplo é destinado como base para sua própria estratégia personalizada e para ajudá-lo a se familiarizar com a aplicação web Expert Advisor Builder. Para importar e usar um exemplo, siga as instruções fornecidas aqui.
Descrição
Este exemplo demonstra news trading para eventos econômicos de alto impacto em todas as moedas globais. A estratégia abre posições 15 minutos antes e depois das principais divulgações de notícias, aproveitando a maior volatilidade durante esses períodos. O indicador Average True Range (ATR) fornece níveis de Stop Loss adaptativos que se ajustam à volatilidade atual do mercado.
Uma característica única é o trailing de Stop Loss que se ativa imediatamente na abertura da operação, ajustando-se continuamente com base nos valores do ATR. Isso protege os lucros à medida que o preço se move favoravelmente, enquanto dá às operações espaço para se desenvolver. O ajuste de encaminhamento de 2,50 multiplica o valor do ATR, criando espaçamento adequado para condições voláteis de notícias.
Eventos de alto impacto, como decisões sobre taxas de juros e relatórios de emprego, geralmente criam movimentos de preço significativos. Esta estratégia posiciona os traders para capturar esses movimentos enquanto gerencia o risco por meio de Stop Losses dinâmicos que respondem a mudanças nos níveis de volatilidade durante as divulgações de notícias.
Reproduzir o exemplo
Você pode importar este exemplo diretamente ou configurá-lo manualmente. Para replicar manualmente o módulo de trading, certifique-se de que um módulo recém-adicionado inclua as seguintes configurações principais e que o modo profissional esteja ativado:
Trade Basics
- Operation type = Long
Signal Generation - Indicators (ATR)
- Signal in use = On
- Signal used for = Forward
- Selected indicator = ATR
- Drawing in chart = On
- Drawing slot = 1
- Forward adjustment = 2.50
Signal Generation - News
- Signal in use = On
- Signal used for = Entry
- Draw table with upcoming events = Off
- Pre event signal time = 900
- Post event signal time = 900
- Signals for ALL regions = On
- Signals for AUD region = On
- Signals for BRL region = On
- Signals for CAD region = On
- Signals for CHF region = On
- Signals for CNY region = On
- Signals for EUR region = On
- Signals for GBP region = On
- Signals for HKD region = On
- Signals for INR region = On
- Signals for JPY region = On
- Signals for KRW region = On
- Signals for MXN region = On
- Signals for NOK region = On
- Signals for NZD region = On
- Signals for SEK region = On
- Signals for SGD region = On
- Signals for USD region = On
- Signals for ZAR region = On
- Signals for undefined importance = Off
- Signals for low importance = Off
- Signals for moderate importance = Off
- Signals for high importance = On
Initial Stop Loss
- Selection = Indicator value
- Used indicator = ATR
Stop Loss Trailing - Indicator value
- Activation position = 0
- Type = Indicator value
- Used indicator = ATR
Initial Take Profit
- Selection = Risk ratio
- Risk ratio = 1.40
Capturas de tela
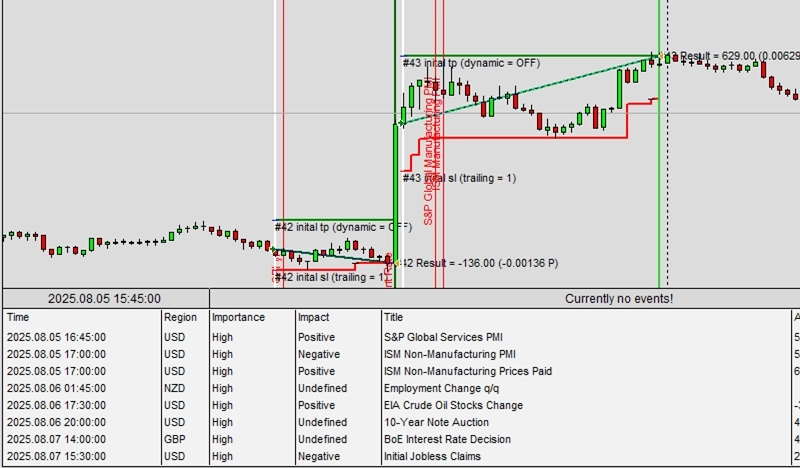
Exemplo A5: News trading de eventos de calendário regionais de alto impacto
CAUTION
Esta não é uma estratégia de trading pronta para uso. Uma estratégia de trading requer ajuste do timeframe e do símbolo, além de backtesting rigoroso. O exemplo é destinado como base para sua própria estratégia personalizada e para ajudá-lo a se familiarizar com a aplicação web Expert Advisor Builder. Para importar e usar um exemplo, siga as instruções fornecidas aqui.
Descrição
Este exemplo foca em news trading regional, visando especificamente eventos econômicos do EUR e USD. Ao contrário do exemplo anterior de news trading, esta estratégia filtra eventos por região de moeda, permitindo que os traders se especializem em pares específicos como EURUSD. A recomendação de timeframe de 15 minutos ajuda a capturar movimentos rápidos de preço após os anúncios.
A configuração mantém o mesmo sistema de gestão de risco baseado em ATR com trailing stops ativados desde a abertura da posição. Ao limitar os sinais apenas a eventos do EUR e USD, os traders evitam geração excessiva de sinais e podem focar em entender como economias específicas afetam o par de moedas escolhido.
A filtragem regional é especialmente útil para traders que acompanham de perto zonas econômicas específicas. Os anúncios do Banco Central Europeu e do Federal Reserve normalmente têm o maior impacto no EURUSD, tornando essa abordagem direcionada mais eficiente do que monitorar todos os eventos globais simultaneamente.
INFO
Recomendado usar EURUSD M15
Reproduzir o exemplo
Você pode importar este exemplo diretamente ou configurá-lo manualmente. Para replicar manualmente o módulo de trading, certifique-se de que um módulo recém-adicionado inclua as seguintes configurações principais e que o modo profissional esteja ativado:
Trade Basics
- Operation type = Long
Signal Generation - Indicators (ATR)
- Signal in use = On
- Signal used for = Forward
- Selected indicator = ATR
- Drawing in chart = On
- Drawing slot = 1
- Forward adjustment = 2.50
Signal Generation - News
- Signal in use = On
- Signal used for = Entry
- Draw table with upcoming events = Off
- Pre event signal time = 900
- Post event signal time = 900
- Signals for ALL regions = Off
- Signals for AUD region = Off
- Signals for BRL region = Off
- Signals for CAD region = Off
- Signals for CHF region = Off
- Signals for CNY region = Off
- Signals for EUR region = On
- Signals for GBP region = Off
- Signals for HKD region = Off
- Signals for INR region = Off
- Signals for JPY region = Off
- Signals for KRW region = Off
- Signals for MXN region = Off
- Signals for NOK region = Off
- Signals for NZD region = Off
- Signals for SEK region = Off
- Signals for SGD region = Off
- Signals for USD region = On
- Signals for ZAR region = Off
- Signals for undefined importance = Off
- Signals for low importance = Off
- Signals for moderate importance = Off
- Signals for high importance = On
Initial Stop Loss
- Selection = Indicator value
- Used indicator = ATR
Stop Loss Trailing - Indicator value
- Activation position = 0
- Type = Indicator value
- Used indicator = ATR
Initial Take Profit
- Selection = Risk ratio
- Risk ratio = 1.40
Capturas de tela
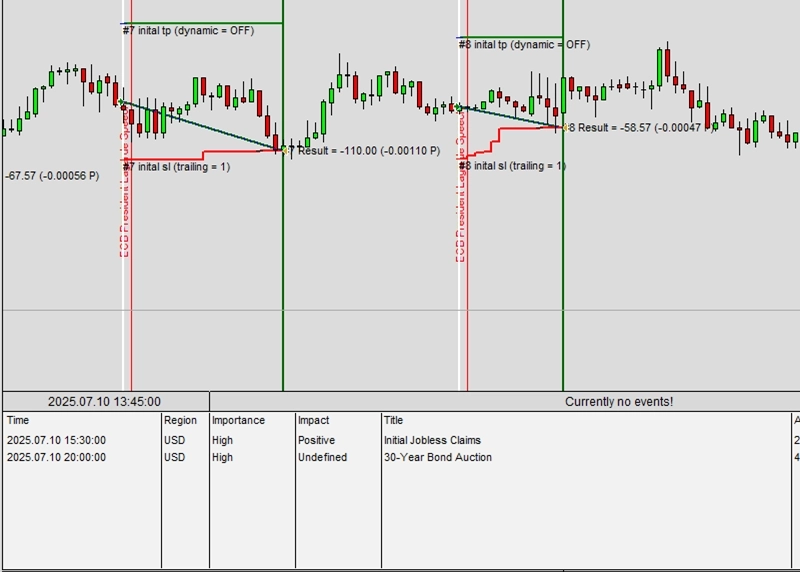
Exemplo A6: Evitando eventos de calendário de alto impacto
CAUTION
Esta não é uma estratégia de trading pronta para uso. Uma estratégia de trading requer ajuste do timeframe e do símbolo, além de backtesting rigoroso. O exemplo é destinado como base para sua própria estratégia personalizada e para ajudá-lo a se familiarizar com a aplicação web Expert Advisor Builder. Para importar e usar um exemplo, siga as instruções fornecidas aqui.
Descrição
Este exemplo ilustra o news trading defensivo, evitando eventos de alto impacto em vez de operá-los. O recurso de inversão de sinal reverte a lógica, gerando sinais de entrada apenas durante períodos calmos sem notícias importantes. O buffer estendido de 2 horas antes e depois dos eventos garante a evitação completa da volatilidade relacionada a notícias.
O sistema de cruzamento MACD fornece os sinais de entrada primários durante esses períodos calmos. O sistema de Stop Loss baseado em ATR e trailing se adapta às condições de menor volatilidade típicas de períodos sem notícias. Essa abordagem é adequada para traders conservadores que preferem condições de mercado previsíveis a eventos de notícias potencialmente lucrativos, mas arriscados.
Ao combinar análise técnica com filtragem de notícias, esta estratégia captura tendências constantes enquanto evita picos imprevisíveis. As linhas de sinal visuais ajudam os traders a ver exatamente quando o sistema bloqueia operações devido a eventos próximos, proporcionando transparência no processo de tomada de decisão.
Reproduzir o exemplo
Você pode importar este exemplo diretamente ou configurá-lo manualmente. Para replicar manualmente o módulo de trading, certifique-se de que um módulo recém-adicionado inclua as seguintes configurações principais e que o modo profissional esteja ativado:
Trade Basics
- Operation type = Long
Signal Generation - Indicators (ATR)
- Signal in use = On
- Signal used for = Forward
- Selected indicator = ATR
- Drawing in chart = On
- Drawing slot = 1
- Forward adjustment = 2.50
Signal Generation - Indicators (MACD Main line)
- Signal in use = On
- Signal used for = Entry
- Selected indicator = MACD
- Line index = Main line
- Draw in chart = On
- Drawing slot = 2
Signal Generation - Indicators (MACD Signal line)
- Signal in use = On
- Signal used for = Entry
- Selected indicator = MACD
- Line index = Signal line
- Draw in chart = On
- Drawing slot = 3
Signal Generation - Indicator Combinations (MACD Main line & MACD Signal line)
- Signal in use = On
- Signal used for = Entry
- Input indicator 1 = MACD (Main line)
- Input indicator 2 = MACD (Signal line)
- Value relation = Value x cross value x
Signal Generation - News
- Signal in use = On
- Signal used for = Entry
- Signal visualization = On
- Draw table with upcoming events = Off
- Signal inversion = On
- Pre event signal time = 7200
- Post event signal time = 7200
- Signals for ALL regions = On
- Signals for AUD region = On
- Signals for BRL region = On
- Signals for CAD region = On
- Signals for CHF region = On
- Signals for CNY region = On
- Signals for EUR region = On
- Signals for GBP region = On
- Signals for HKD region = On
- Signals for INR region = On
- Signals for JPY region = On
- Signals for KRW region = On
- Signals for MXN region = On
- Signals for NOK region = On
- Signals for NZD region = On
- Signals for SEK region = On
- Signals for SGD region = On
- Signals for USD region = On
- Signals for ZAR region = On
- Signals for undefined importance = Off
- Signals for low importance = Off
- Signals for moderate importance = Off
- Signals for high importance = On
Initial Stop Loss
- Selection = Indicator value
- Used indicator = ATR
Stop Loss Trailing - Indicator value
- Activation position = 0
- Type = Indicator value
- Used indicator = ATR
Initial Take Profit
- Selection = Risk ratio
- Risk ratio = 1.40
Capturas de tela
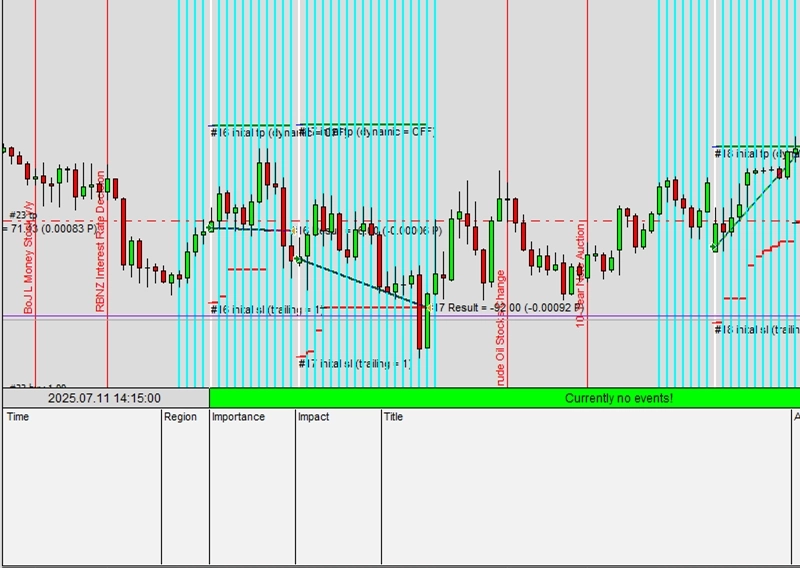
Exemplo A7: Um analisador de gráficos para geração de sinais
CAUTION
Esta não é uma estratégia de trading pronta para uso. Uma estratégia de trading requer ajuste do timeframe e do símbolo, além de backtesting rigoroso. O exemplo é destinado como base para sua própria estratégia personalizada e para ajudá-lo a se familiarizar com a aplicação web Expert Advisor Builder. Para importar e usar um exemplo, siga as instruções fornecidas aqui.
Descrição
Este exemplo apresenta o analisador de gráficos para geração de sinais baseada em volatilidade. O analisador examina as últimas 50 barras para determinar os níveis de volatilidade do mercado, gerando sinais apenas durante períodos de alta volatilidade, quando os movimentos de preço oferecem melhor potencial de lucro. Essa filtragem inteligente reduz sinais falsos durante condições de mercado tranquilas.
O Stop Loss fixo de 200 pips fornece gestão de risco consistente, enquanto o risk ratio de 1,40 mantém potencial de recompensa favorável. Os indicadores visuais do analisador de gráficos ajudam os traders a entender as condições atuais do mercado de relance, mostrando se a volatilidade atende ao limite para trading.
Essa abordagem funciona particularmente bem para traders de momentum que prosperam em mercados ativos. Ao aguardar a confirmação de alta volatilidade, a estratégia evita a ação de preço agitada e sem direção comum em mercados de range, focando em vez disso em períodos com movimento direcional claro.
Reproduzir o exemplo
Você pode importar este exemplo diretamente ou configurá-lo manualmente. Para replicar manualmente o módulo de trading, certifique-se de que um módulo recém-adicionado inclua as seguintes configurações principais e que o modo profissional esteja ativado:
Trade Basics
- Operation type = Long
Signal Generation - Chart Analyzer
- Signal in use = On
- Signal used for = Entry
- Signal visualization = On
- Analyzed width = 50
- Signal if volatility is low = Off
- Signal if volatility is middle = Off
- Signal if volatility is high = On
Initial Stop Loss
- Selection = Fix pips
- Fix pips = 200
Initial Take Profit
- Selection = Risk ratio
- Risk ratio = 1.40
Capturas de tela
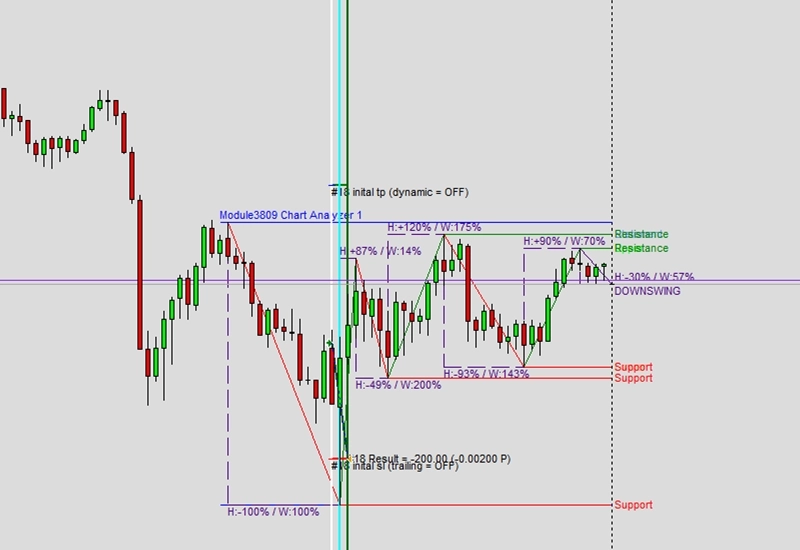
Exemplo B1: Trading em horários específicos
CAUTION
Esta não é uma estratégia de trading pronta para uso. Uma estratégia de trading requer ajuste do timeframe e do símbolo, além de backtesting rigoroso. O exemplo é destinado como base para sua própria estratégia personalizada e para ajudá-lo a se familiarizar com a aplicação web Expert Advisor Builder. Para importar e usar um exemplo, siga as instruções fornecidas aqui.
Descrição
Este exemplo demonstra restrições de trading baseadas em tempo, limitando a atividade a horários específicos do dia. A estratégia permite operações apenas entre 6h e 11h e entre 14h e 19h, evitando sessões noturnas e horários de almoço quando a liquidez pode ser menor. Os indicadores de temporização visuais no gráfico mostram claramente os períodos ativos e restritos.
O sistema de cruzamento de SMA e EMA fornece sinais de entrada, mas apenas durante as horas permitidas. Mesmo que ocorram sinais perfeitos fora dessas janelas, o sistema os ignora completamente. O indicador de Desvio Padrão gerencia os Stop Losses com seu sistema de ajuste de encaminhamento.
O dimensionamento fixo de 0,10 lot simplifica o gerenciamento de posição para iniciantes. As restrições de tempo ajudam os traders a se concentrar nas sessões de mercado mais líquidas, quando os spreads são mais estreitos e a ação de preço mais confiável.
Reproduzir o exemplo
Você pode importar este exemplo diretamente ou configurá-lo manualmente. Para replicar manualmente o módulo de trading, certifique-se de que um módulo recém-adicionado inclua as seguintes configurações principais e que o modo profissional esteja ativado:
Trade Basics
- Operation type = Long
Signal Generation - Indicators - STD
- Signal in use = On
- Signal used for = Forward
- Selected indicator = STD
- Draw in chart = Off
- Forward adjustment = 3.50
Signal Generation - Indicators - SMA
- Signal in use = On
- Signal used for = Entry
- Selected indicator = SMA
- Draw in chart = On
- Drawing slot = 1
Signal Generation - Indicators - EMA
- Signal in use = On
- Signal used for = Entry
- Selected indicator = EMA
- Draw in chart = On
- Drawing slot = 2
Signal Generation - Indicator Combinations (SMA & EMA)
- Signal in use = On
- Signal used for = Entry
- Input indicator 1 = SMA
- Input indicator 2 = EMA
- Value relation = Value x cross value x
Initial Stop Loss
- Selection = Indicator
- Used indicator = STD
Initial Take Profit
- Selection = Risk ratio
- Risk ratio = 1.40
Timing
- Visualize timing = On
- Trading hours = 6-11;14-19
Volume Calculation
- Volume calculation method = Fix lots
- Fix lots = 0.10
Capturas de tela
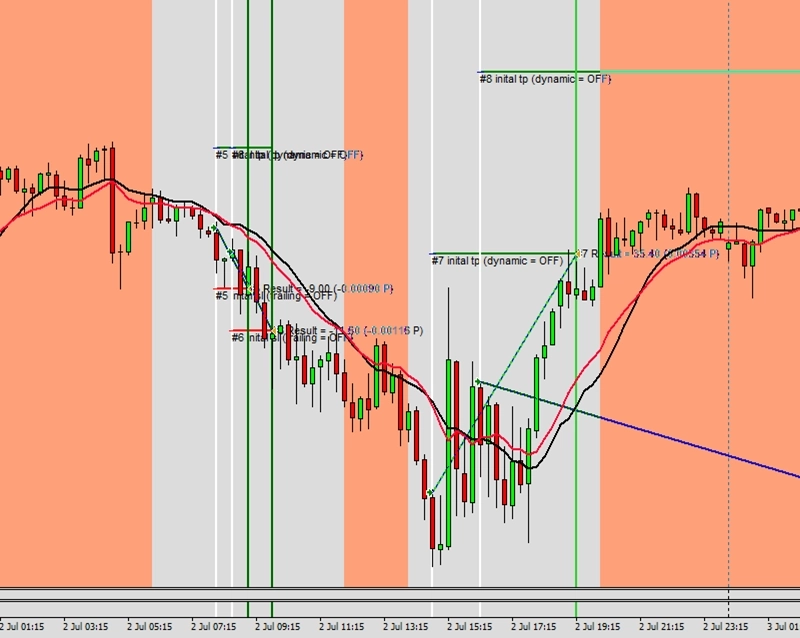
Exemplo B2: Trading em dias específicos da semana
CAUTION
Esta não é uma estratégia de trading pronta para uso. Uma estratégia de trading requer ajuste do timeframe e do símbolo, além de backtesting rigoroso. O exemplo é destinado como base para sua própria estratégia personalizada e para ajudá-lo a se familiarizar com a aplicação web Expert Advisor Builder. Para importar e usar um exemplo, siga as instruções fornecidas aqui.
Descrição
Este exemplo estende o controle de temporização a dias de semana específicos, permitindo operações apenas nas quartas e quintas-feiras. Pesquisas de mercado frequentemente mostram que certos dias da semana têm características diferentes: as segundas podem ser imprevisíveis, as sextas veem o quadramento de posições, enquanto o meio da semana oferece tendências mais estáveis. O sistema visual de temporização destaca claramente os dias de trading permitidos.
A configuração técnica permanece consistente com cruzamentos de médias móveis para sinais e Desvio Padrão para Stop Losses. Ao limitar o trading a dois dias, a estratégia reduz a exposição ao mercado enquanto potencialmente melhora as taxas de acerto ao focar em períodos estatisticamente favoráveis.
Essa abordagem é adequada para traders de meio período que não conseguem monitorar os mercados diariamente. O tamanho de lote fixo e o risk ratio mantêm a gestão de dinheiro simples e consistente.
Reproduzir o exemplo
Você pode importar este exemplo diretamente ou configurá-lo manualmente. Para replicar manualmente o módulo de trading, certifique-se de que um módulo recém-adicionado inclua as seguintes configurações principais e que o modo profissional esteja ativado:
Trade Basics
- Operation type = Long
Signal Generation - Indicators - STD
- Signal in use = On
- Signal used for = Forward
- Selected indicator = STD
- Draw in chart = Off
- Forward adjustment = 3.50
Signal Generation - Indicators - SMA
- Signal in use = On
- Signal used for = Entry
- Selected indicator = SMA
- Draw in chart = On
- Drawing slot = 1
Signal Generation - Indicators - EMA
- Signal in use = On
- Signal used for = Entry
- Selected indicator = EMA
- Draw in chart = On
- Drawing slot = 2
Signal Generation - Indicator Combinations (SMA & EMA)
- Signal in use = On
- Signal used for = Entry
- Input indicator 1 = SMA
- Input indicator 2 = EMA
- Value relation = Value x cross value x
Initial Stop Loss
- Selection = Indicator
- Used indicator = STD
Initial Take Profit
- Selection = Risk ratio
- Risk ratio = 1.40
Timing
- Visualize timing = On
- Trading days of week = Wednesday-Thursday
Volume Calculation
- Volume calculation method = Fix lots
- Fix lots = 0.10
Capturas de tela
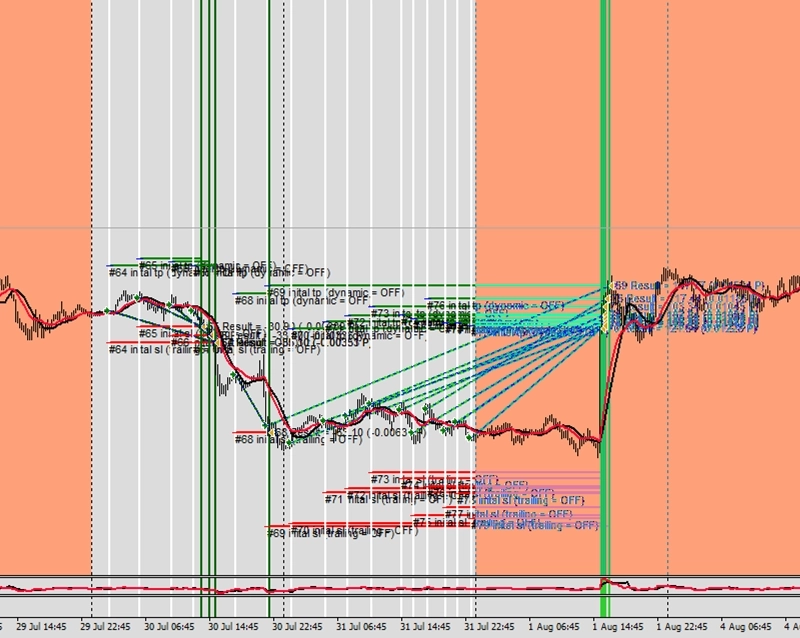
Exemplo B3: Trading em dias específicos do mês
CAUTION
Esta não é uma estratégia de trading pronta para uso. Uma estratégia de trading requer ajuste do timeframe e do símbolo, além de backtesting rigoroso. O exemplo é destinado como base para sua própria estratégia personalizada e para ajudá-lo a se familiarizar com a aplicação web Expert Advisor Builder. Para importar e usar um exemplo, siga as instruções fornecidas aqui.
Descrição
Este exemplo restringe o trading a dias específicos do mês, especificamente os dias 10 a 20. Esse período de meio de mês frequentemente mostra características diferentes do fim ou início do mês, quando ocorre o rebalanceamento institucional. A exibição visual de temporização marca claramente os períodos de trading ativo no gráfico.
Muitos traders notam padrões relacionados a ciclos mensais: pagamentos de salários, expirações de opções e relatórios trimestrais criam comportamentos de mercado recorrentes. Ao focar no terço médio de cada mês, essa estratégia evita esses eventos potencialmente disruptivos enquanto captura tendências constantes de meio de mês.
Os indicadores técnicos permanecem inalterados, provando que os filtros de temporização podem aprimorar qualquer estratégia sem modificar a lógica central do sinal.
Reproduzir o exemplo
Você pode importar este exemplo diretamente ou configurá-lo manualmente. Para replicar manualmente o módulo de trading, certifique-se de que um módulo recém-adicionado inclua as seguintes configurações principais e que o modo profissional esteja ativado:
Trade Basics
- Operation type = Long
Signal Generation - Indicators - STD
- Signal in use = On
- Signal used for = Forward
- Selected indicator = STD
- Draw in chart = Off
- Forward adjustment = 3.50
Signal Generation - Indicators - SMA
- Signal in use = On
- Signal used for = Entry
- Selected indicator = SMA
- Draw in chart = On
- Drawing slot = 1
Signal Generation - Indicators - EMA
- Signal in use = On
- Signal used for = Entry
- Selected indicator = EMA
- Draw in chart = On
- Drawing slot = 2
Signal Generation - Indicator Combinations (SMA & EMA)
- Signal in use = On
- Signal used for = Entry
- Input indicator 1 = SMA
- Input indicator 2 = EMA
- Value relation = Value x cross value x
Initial Stop Loss
- Selection = Indicator
- Used indicator = STD
Initial Take Profit
- Selection = Risk ratio
- Risk ratio = 1.40
Timing
- Visualize timing = On
- Trading days = 10-20
Volume Calculation
- Volume calculation method = Fix lots
- Fix lots = 0.10
Capturas de tela
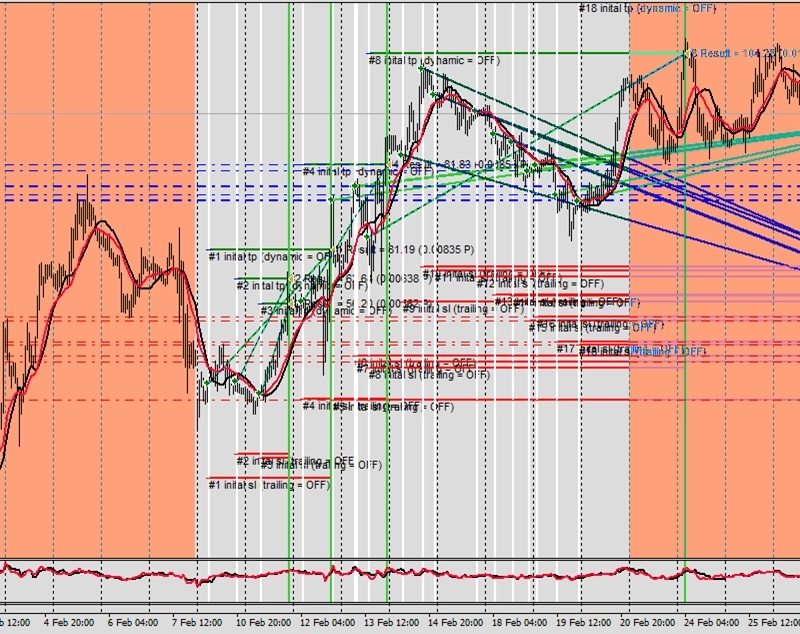
Exemplo B4: Modo de trading intradiário com fechamentos forçados no fim do dia
CAUTION
Esta não é uma estratégia de trading pronta para uso. Uma estratégia de trading requer ajuste do timeframe e do símbolo, além de backtesting rigoroso. O exemplo é destinado como base para sua própria estratégia personalizada e para ajudá-lo a se familiarizar com a aplicação web Expert Advisor Builder. Para importar e usar um exemplo, siga as instruções fornecidas aqui.
Descrição
Este exemplo implementa o modo de trading intradiário com fechamentos forçados no fim do dia. As posições só podem ser abertas entre 9h e 18h, com todas as operações fechadas automaticamente às 21h, independentemente do lucro ou prejuízo. Isso evita riscos overnight e encargos de swap, garantindo começos limpos a cada dia de trading.
O recurso de fechamento forçado distingue isso de simples restrições de tempo. Mesmo operações lucrativas devem ser fechadas antes do prazo, evitando a tentação de manter posições durante a noite. Essa disciplina é valiosa para day traders que devem manter separação estrita entre os dias de trading.
Os indicadores de temporização visuais mostram três zonas: transparente para trading completo, laranja para períodos somente de saída e vermelho para horários de fechamento forçado.
Reproduzir o exemplo
Você pode importar este exemplo diretamente ou configurá-lo manualmente. Para replicar manualmente o módulo de trading, certifique-se de que um módulo recém-adicionado inclua as seguintes configurações principais e que o modo profissional esteja ativado:
Trade Basics
- Operation type = Long
Signal Generation - Indicators - STD
- Signal in use = On
- Signal used for = Forward
- Selected indicator = STD
- Draw in chart = Off
- Forward adjustment = 3.50
Signal Generation - Indicators - SMA
- Signal in use = On
- Signal used for = Entry
- Selected indicator = SMA
- Draw in chart = On
- Drawing slot = 1
Signal Generation - Indicators - EMA
- Signal in use = On
- Signal used for = Entry
- Selected indicator = EMA
- Draw in chart = On
- Drawing slot = 2
Signal Generation - Indicator Combinations (SMA & EMA)
- Signal in use = On
- Signal used for = Entry
- Input indicator 1 = SMA
- Input indicator 2 = EMA
- Value relation = Value x cross value x
Initial Stop Loss
- Selection = Indicator
- Used indicator = STD
Initial Take Profit
- Selection = Risk ratio
- Risk ratio = 1.40
Timing
- Visualize timing = On
- Intraday mode = 09:00:00
- Start intraday trading = 18:00:00
- Deadline intraday trading = 21:00:00
- Intraday mode = On
Volume Calculation
- Volume calculation method = Fix lots
- Fix lots = 0.10
Capturas de tela
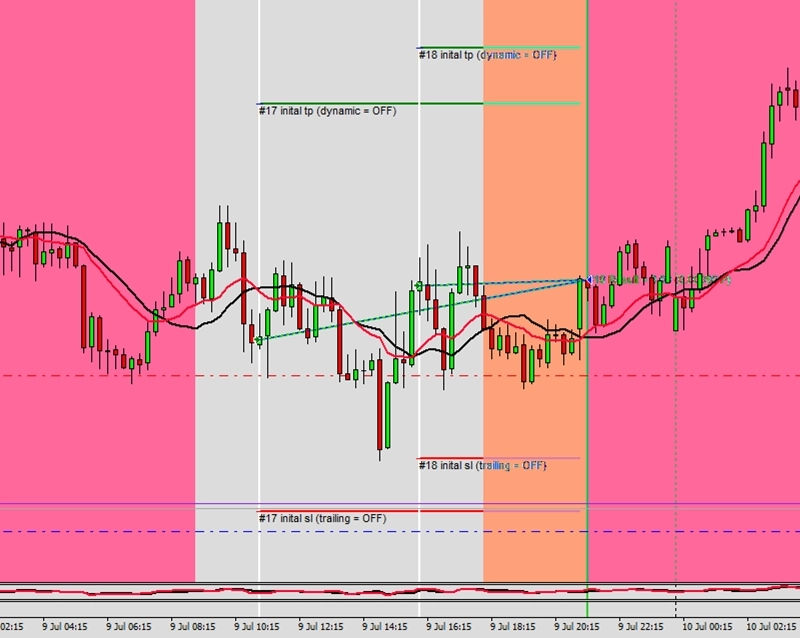
Exemplo B5: Deslocamento automático de sinais conforme o horário de verão (DST)
CAUTION
Esta não é uma estratégia de trading pronta para uso. Uma estratégia de trading requer ajuste do timeframe e do símbolo, além de backtesting rigoroso. O exemplo é destinado como base para sua própria estratégia personalizada e para ajudá-lo a se familiarizar com a aplicação web Expert Advisor Builder. Para importar e usar um exemplo, siga as instruções fornecidas aqui.
Descrição
Este exemplo aborda os ajustes de horário de verão (DST), deslocando automaticamente os horários de trading quando ocorrem mudanças de DST. A configuração mostra regras complexas de DST com datas de início e fim diferentes, demonstrando como o sistema se adapta a variações de fuso horário. Isso garante que as estratégias mantenham temporização de mercado consistente ao longo do ano.
Os sinais baseados em notícias combinam com restrições horárias para criar um sofisticado sistema de temporização. Quando ocorrem mudanças de DST, todo o cronograma se ajusta automaticamente, mantendo o alinhamento com as sessões de mercado reais, em vez do horário do relógio. Isso evita que as estratégias operem em horários não intencionados após as mudanças de DST.
Múltiplas capturas de tela mostram o sistema operando corretamente em diferentes períodos de DST. Esse recurso avançado é essencial para estratégias dependentes de sessões de mercado específicas, especialmente ao negociar instrumentos de fusos horários diferentes simultaneamente.
CAUTION
Recomendado usar EURUSD M15
Reproduzir o exemplo
Você pode importar este exemplo diretamente ou configurá-lo manualmente. Para replicar manualmente o módulo de trading, certifique-se de que um módulo recém-adicionado inclua as seguintes configurações principais e que o modo profissional esteja ativado:
Trade Basics
- Operation type = Long signals only drawn
- General signal visualization = Off
Signal Generation - News
- Signal in use = On
- Signal used for = Entry
- Signals for ALL regions = Off
- Signals for AUD region = Off
- Signals for BRL region = Off
- Signals for CAD region = Off
- Signals for CHF region = Off
- Signals for CNY region = Off
- Signals for EUR region = On
- Signals for GBP region = Off
- Signals for HKD region = Off
- Signals for INR region = Off
- Signals for JPY region = Off
- Signals for KRW region = Off
- Signals for MXN region = Off
- Signals for NOK region = Off
- Signals for NZD region = Off
- Signals for SEK region = Off
- Signals for SGD region = Off
- Signals for USD region = On
- Signals for ZAR region = Off
- Signals for undefined importance = Off
- Signals for low importance = On
- Signals for moderate importance = On
- Signals for high importance = On
Timing
- Visualize timing = On
- Trading hours = 9-19
- DST summer: Shifted minutes = 60
- DST summer: Start = Mar 2nd Sun 02:00:00
- DST summer: End = Apr 1st Sun 02:00:00
- DST winter: Shifted minutes = -60
- DST winter: Start = Oct 2nd Sun 02:00:00
- DST winter: End = Nov 1st Sun 02:00:00
Capturas de tela
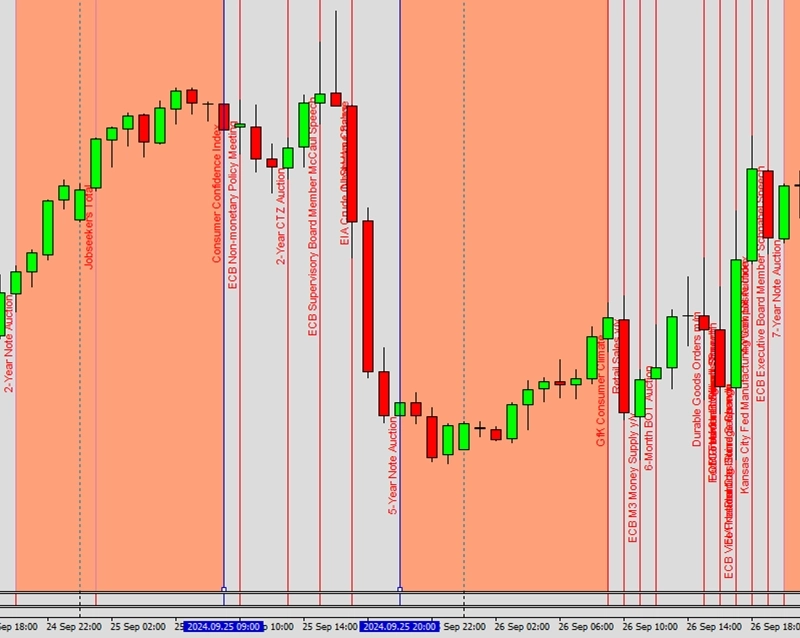
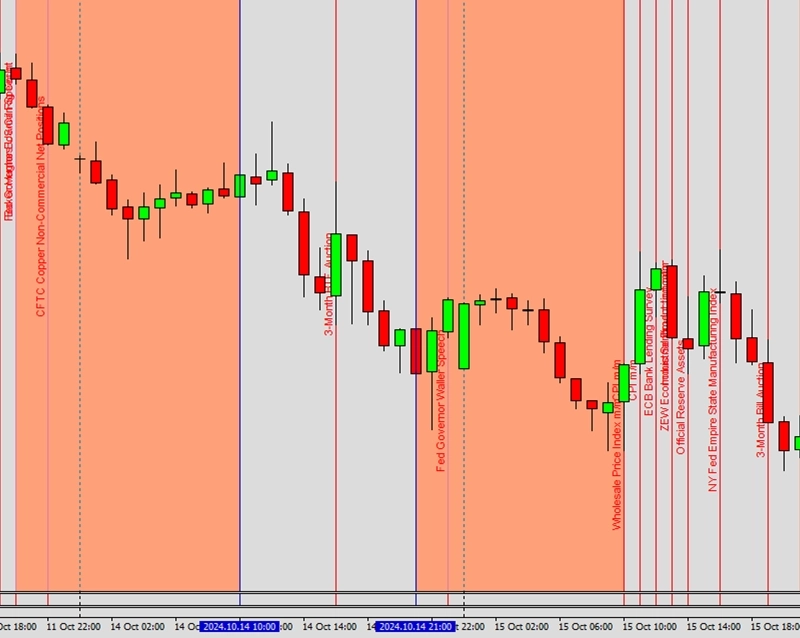
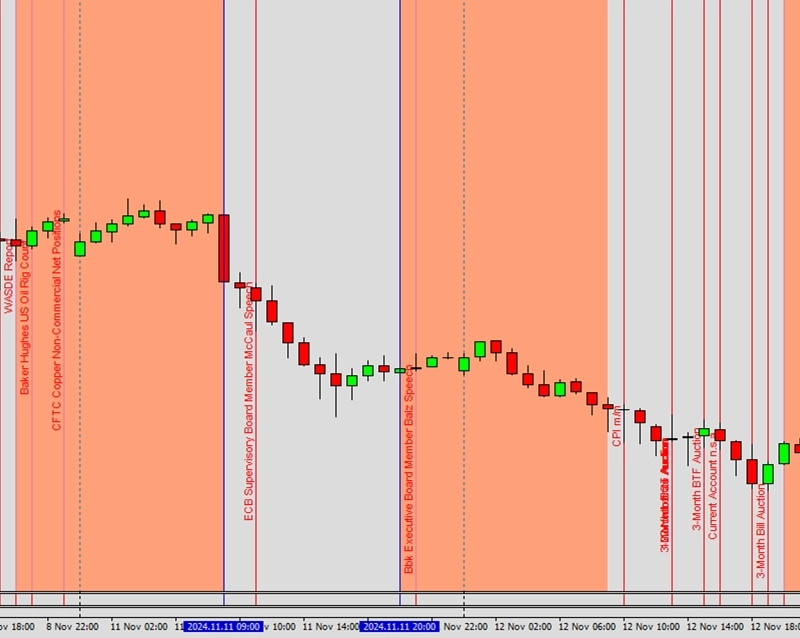
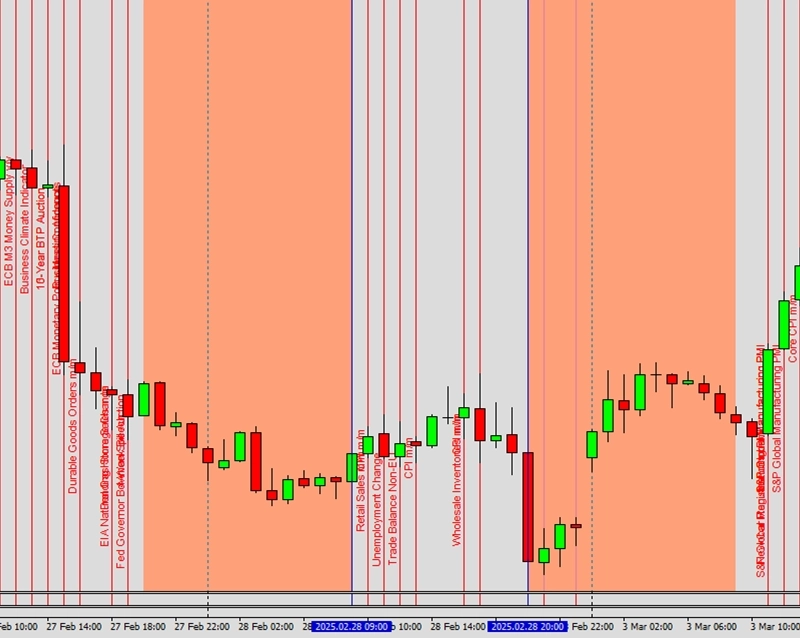
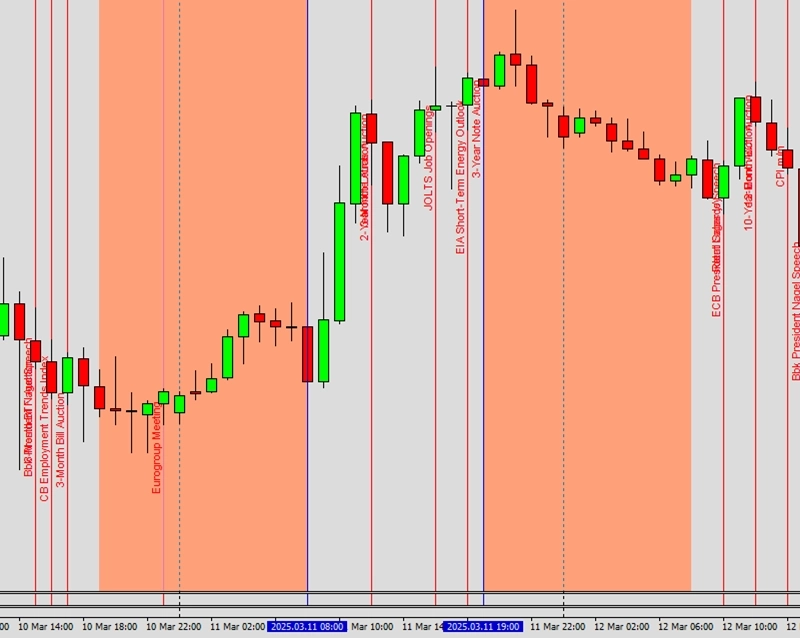
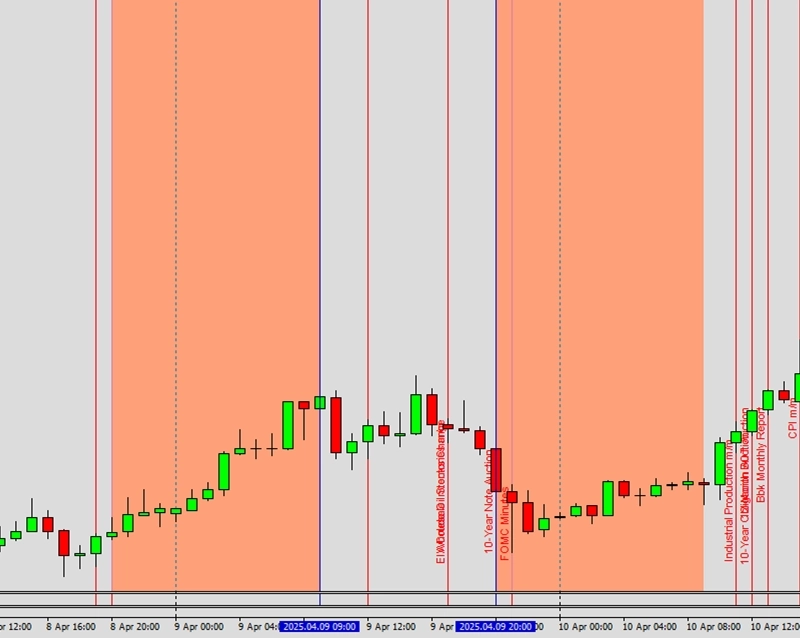
Exemplo C1: Trailing de Stop Loss por average true range
CAUTION
Esta não é uma estratégia de trading pronta para uso. Uma estratégia de trading requer ajuste do timeframe e do símbolo, além de backtesting rigoroso. O exemplo é destinado como base para sua própria estratégia personalizada e para ajudá-lo a se familiarizar com a aplicação web Expert Advisor Builder. Para importar e usar um exemplo, siga as instruções fornecidas aqui.
Descrição
Este exemplo apresenta a funcionalidade básica de trailing de Stop Loss baseada em ATR. O Stop Loss se ajusta continuamente com base nos valores do Average True Range, mantendo uma distância dinâmica do preço atual que se adapta à volatilidade do mercado. A ativação do trailing começa imediatamente na abertura da posição, protegendo a operação desde o início.
O ajuste de encaminhamento de 3,50 multiplica o valor bruto do ATR, criando espaço suficiente para flutuações normais de preço. À medida que a volatilidade aumenta, o Stop Loss automaticamente amplia sua distância; quando os mercados se acalmam, ele aperta. Esse comportamento responsivo evita tanto saídas prematuras quanto exposição excessiva ao risco.
O baixo risk ratio de 1,10 para o Take Profit cria um alvo estreito adequado para condições voláteis. Essa combinação de stops adaptativos e alvos modestos funciona bem em mercados em tendência onde os preços se movem de forma constante, mas com níveis variáveis de volatilidade.
Reproduzir o exemplo
Você pode importar este exemplo diretamente ou configurá-lo manualmente. Para replicar manualmente o módulo de trading, certifique-se de que um módulo recém-adicionado inclua as seguintes configurações principais e que o modo profissional esteja ativado:
Trade Basics
- Operation type = Long
Signal Generation - Indicators (MACD Main line)
- Signal in use = On
- Signal used for = Entry
- Selected indicator = MACD
- Line index = Main line
- Draw in chart = On
- Drawing slot = 1
Signal Generation - Indicators (MACD Signal line)
- Signal in use = On
- Signal used for = Entry
- Selected indicator = MACD
- Line index = Signal line
- Draw in chart = On
- Drawing slot = 2
Signal Generation - Indicators - ATR
- Signal in use = On
- Signal used for = Forward
- Selected indicator = ATR
- Draw in chart = On
- Drawing slot = 3
- Forward adjustment = 3.50
Signal Generation - Indicator Combinations (MACD Main line & MACD Signal line)
- Signal in use = On
- Signal used for = Entry
- Input indicator 1 = MACD (Main line)
- Input indicator 2 = MACD (Signal line)
- Value relation = Value x cross value x
Initial Stop Loss
- Selection = Indicator value
- Used indicator = ATR
Stop Loss Trailing - Indicator value
- Activation position = 0
- Type = Indicator value
- Used indicator = ATR
Initial Take Profit
- Selection = Risk ratio
- Risk ratio = 1.10
Capturas de tela
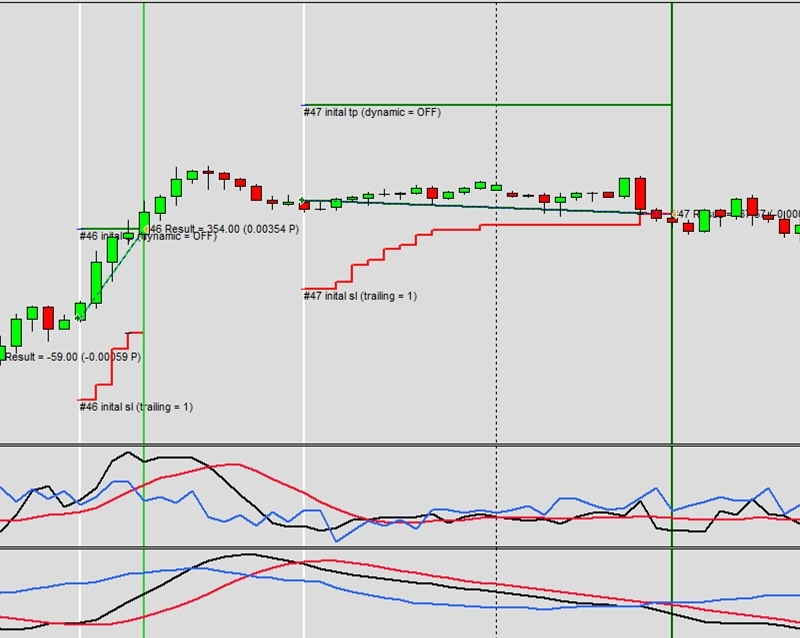
Exemplo C2: Primeiro breakeven, depois trailing de Stop Loss por average true range
CAUTION
Esta não é uma estratégia de trading pronta para uso. Uma estratégia de trading requer ajuste do timeframe e do símbolo, além de backtesting rigoroso. O exemplo é destinado como base para sua própria estratégia personalizada e para ajudá-lo a se familiarizar com a aplicação web Expert Advisor Builder. Para importar e usar um exemplo, siga as instruções fornecidas aqui.
Descrição
Este exemplo demonstra trailing de Stop Loss em múltiplos estágios com componentes de breakeven e ATR. O primeiro estágio move o stop para o breakeven quando o preço atinge 120% do risco inicial, removendo o risco inicial da operação (descontados gaps e slippage). A 150%, o sistema muda para trailing baseado em ATR com um multiplicador mais estreito de 1,50 para acompanhamento mais próximo.
Duas configurações diferentes de ATR oferecem flexibilidade: o stop inicial usa um multiplicador de 2,50 para posicionamento mais amplo, enquanto o estágio de trailing usa 1,50 para acompanhamento mais próximo. Essa abordagem graduada equilibra as necessidades de desenvolvimento inicial da operação com os requisitos posteriores de proteção de lucro.
O sistema baseado em estágios permite gestão de risco sofisticada que se adapta ao progresso da operação. Os estágios iniciais dão espaço para as operações se desenvolverem, enquanto os estágios posteriores apertam o stop de forma mais agressiva para proteger uma parcela maior de um movimento em aberto. Essa abordagem busca equilibrar a gestão da operação com deixar os ganhadores correrem.
Reproduzir o exemplo
Você pode importar este exemplo diretamente ou configurá-lo manualmente. Para replicar manualmente o módulo de trading, certifique-se de que um módulo recém-adicionado inclua as seguintes configurações principais e que o modo profissional esteja ativado:
Trade Basics
- Operation type = Long
Signal Generation - Indicators (MACD Main line)
- Signal in use = On
- Signal used for = Entry
- Selected indicator = MACD
- Line index = Main line
- Draw in chart = On
- Drawing slot = 1
Signal Generation - Indicators (MACD Signal line)
- Signal in use = On
- Signal used for = Entry
- Selected indicator = MACD
- Line index = Signal line
- Draw in chart = On
- Drawing slot = 2
Signal Generation - Indicators - ATR (1)
- Signal in use = On
- Signal used for = Forward
- Selected indicator = ATR
- Draw in chart = On
- Drawing slot = 3
- Forward adjustment = 2.50
Signal Generation - Indicators - ATR (2)
- Signal in use = On
- Signal used for = Forward
- Selected indicator = ATR
- Draw in chart = On
- Drawing slot = 3
- Forward adjustment = 1.50
Signal Generation - Indicator Combinations (MACD Main line & MACD Signal line)
Signal in use = On
Signal used for = Entry
Input indicator 1 = MACD (Main line)
Input indicator 2 = MACD (Signal line)
Value relation = Value x cross value x
Initial Stop Loss
- Selection = Indicator value
- Used indicator = ATR (1)
Stop Loss Trailing - Breakeven
- Activation position = 0
- Type = Breakeven
- Breakeven position = 120
Stop Loss Trailing - Indicator value
- Activation position = 150
- Type = Indicator value
- Used indicator = ATR (2)
Initial Take Profit
- Selection = Risk ratio
- Risk ratio = 1.40
Capturas de tela
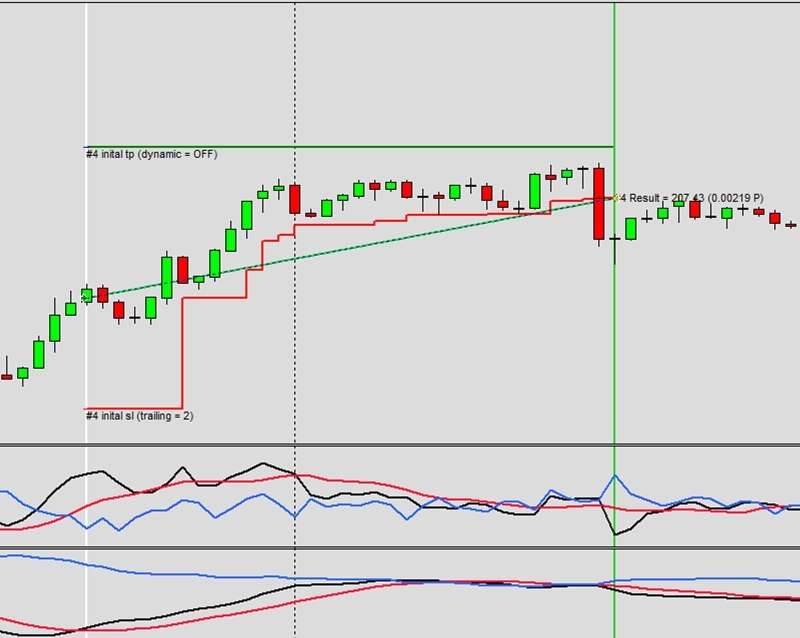
Exemplo C3: Primeiro breakeven, depois average true range, depois trailing de Stop Loss de mercado
CAUTION
Esta não é uma estratégia de trading pronta para uso. Uma estratégia de trading requer ajuste do timeframe e do símbolo, além de backtesting rigoroso. O exemplo é destinado como base para sua própria estratégia personalizada e para ajudá-lo a se familiarizar com a aplicação web Expert Advisor Builder. Para importar e usar um exemplo, siga as instruções fornecidas aqui.
Descrição
Este exemplo estende os trailing stops a três estágios: breakeven, baseado em ATR e baseado em mercado. Cada estágio é ativado em níveis de lucro específicos, criando proteção de lucro progressivamente mais agressiva à medida que as operações têm sucesso. O estágio final baseado em mercado segue o preço de forma extremamente próxima usando extremos de velas anteriores.
O estágio de trailing de mercado adiciona buffers fixos e baseados em spread, evitando que os stops sejam acionados por alargamento normal de spread. Sem Take Profit definido, as operações podem ser executadas indefinidamente até que o trailing stop capture os lucros. Essa abordagem de fim aberto captura grandes tendências enquanto protege os ganhos acumulados.
O escalonamento progressivo representa gestão avançada de posição, permitindo diferentes estratégias em diferentes níveis de lucro. Essa flexibilidade ajuda os traders a se adaptar às condições de mercado em mudança dentro de uma única operação, maximizando o potencial de lucro enquanto gerencia o risco de forma dinâmica.
Reproduzir o exemplo
Você pode importar este exemplo diretamente ou configurá-lo manualmente. Para replicar manualmente o módulo de trading, certifique-se de que um módulo recém-adicionado inclua as seguintes configurações principais e que o modo profissional esteja ativado:
Trade Basics
- Operation type = Long
Signal Generation - Indicators (MACD Main line)
- Signal in use = On
- Signal used for = Entry
- Selected indicator = MACD
- Line index = Main line
- Draw in chart = On
- Drawing slot = 1
Signal Generation - Indicators (MACD Signal line)
- Signal in use = On
- Signal used for = Entry
- Selected indicator = MACD
- Line index = Signal line
- Draw in chart = On
- Drawing slot = 2
Signal Generation - Indicators - ATR (1)
- Signal in use = On
- Signal used for = Forward
- Selected indicator = ATR
- Draw in chart = On
- Drawing slot = 3
- Forward adjustment = 2.50
Signal Generation - Indicators - ATR (2)
- Signal in use = On
- Signal used for = Forward
- Selected indicator = ATR
- Draw in chart = On
- Drawing slot = 3
- Forward adjustment = 1.50
Signal Generation - Indicator Combinations (MACD Main line & MACD Signal line)
- Signal in use = On
- Signal used for = Entry
- Input indicator 1 = MACD (Main line)
- Input indicator 2 = MACD (Signal line)
- Value relation = Value x cross value x
Initial Stop Loss
- Selection = Indicator value
- Used indicator = ATR (1)
Stop Loss Trailing - Breakeven
- Activation position = 0
- Type = Breakeven
- Breakeven position = 120
Stop Loss Trailing - Indicator value
- Activation position = 150
- Type = Indicator value
- Used indicator = ATR (2)
Stop Loss Trailing - Market
- Activation position = 200
- Type = Market
- Market buffer fix = 10
- Market buffer spread = 4.0
Initial Take Profit
- Selection = Off
Capturas de tela
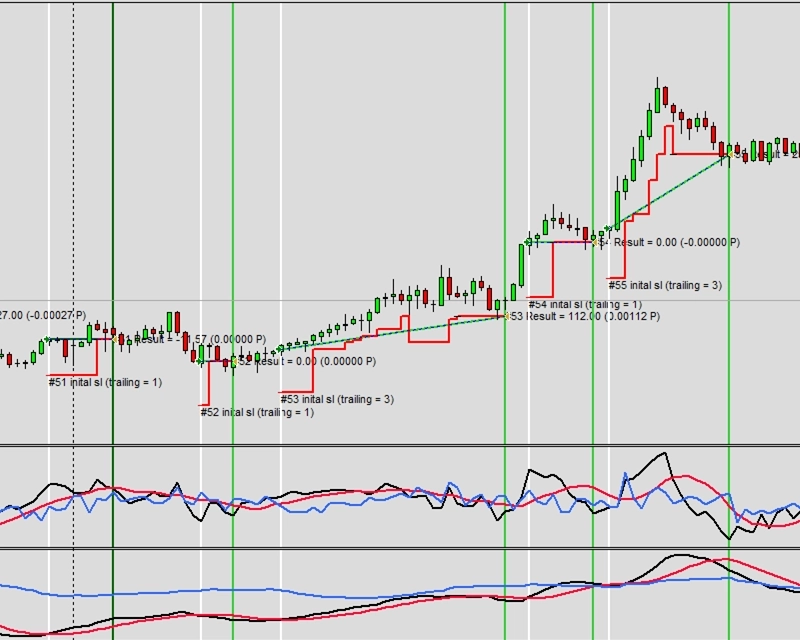
Exemplo D1: Distância fixa em pips como Stop Loss inicial e Take Profit inicial
CAUTION
Esta não é uma estratégia de trading pronta para uso. Uma estratégia de trading requer ajuste do timeframe e do símbolo, além de backtesting rigoroso. O exemplo é destinado como base para sua própria estratégia personalizada e para ajudá-lo a se familiarizar com a aplicação web Expert Advisor Builder. Para importar e usar um exemplo, siga as instruções fornecidas aqui.
Descrição
Este exemplo usa valores fixos de pips tanto para os níveis de Stop Loss quanto de Take Profit. O Stop Loss de 200 pips e o Take Profit de 300 pips criam um risk ratio favorável de 1,5 usando distâncias absolutas. Essa abordagem simples não requer cálculos complexos, tornando-a ideal para iniciantes aprendendo os conceitos básicos de gestão de posição.
Estratégias de pips fixos funcionam melhor em ambientes de volatilidade estável, onde os movimentos de preço típicos permanecem consistentes. A recomendação para timeframes entre M1 e H1 sugere que essa abordagem é adequada para trading intradiário, onde os ranges diários são relativamente previsíveis.
Embora simples, os métodos de pips fixos podem exigir ajuste à medida que as condições de mercado mudam ao longo do tempo. Os traders devem revisar periodicamente esses valores para garantir que permaneçam adequados para os níveis de volatilidade atuais do mercado.
CAUTION
Recomendado usar EURUSD M1 - H1
Reproduzir o exemplo
Você pode importar este exemplo diretamente ou configurá-lo manualmente. Para replicar manualmente o módulo de trading, certifique-se de que um módulo recém-adicionado inclua as seguintes configurações principais e que o modo profissional esteja ativado:
Trade Basics
- Operation type = Long
Signal Generation - Indicators - SMA
- Signal in use = On
- Signal used for = Entry
- Selected indicator = SMA
- Draw in chart = On
- Drawing slot = 1
Signal Generation - Indicators - EMA
- Signal in use = On
- Signal used for = Entry
- Selected indicator = EMA
- Draw in chart = On
- Drawing slot = 2
Signal Generation - Indicator Combinations (SMA & EMA)
- Signal in use = On
- Signal used for = Entry
- Input indicator 1 = SMA
- Input indicator 2 = EMA
- Value relation = Value x cross value x
Initial Stop Loss
- Selection = Fix pips
- Fix pips = 200
Initial Take Profit
- Selection = Fix pips
- Fix pips = 300
Capturas de tela
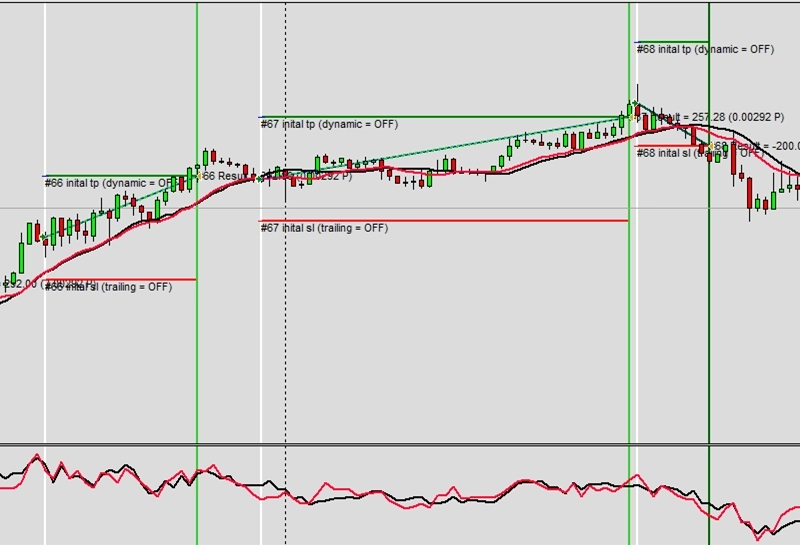
Exemplo D2: Valor de indicador para Stop Loss inicial e Take Profit inicial
CAUTION
Esta não é uma estratégia de trading pronta para uso. Uma estratégia de trading requer ajuste do timeframe e do símbolo, além de backtesting rigoroso. O exemplo é destinado como base para sua própria estratégia personalizada e para ajudá-lo a se familiarizar com a aplicação web Expert Advisor Builder. Para importar e usar um exemplo, siga as instruções fornecidas aqui.
Descrição
Este exemplo usa as Bollinger Bands para definir dinamicamente os níveis de Stop Loss e Take Profit. A banda inferior determina o posicionamento do Stop Loss, enquanto a banda superior define os alvos de Take Profit, criando um intervalo estatisticamente baseado para cada operação. Essa abordagem adaptativa se ajusta automaticamente à volatilidade do mercado sem intervenção manual.
Usar indicadores para ambos os níveis garante relações risco/recompensa consistentes, independentemente das condições de mercado. À medida que as Bollinger Bands se expandem durante períodos voláteis, tanto os stops quanto os alvos se ampliam proporcionalmente. Durante períodos calmos, eles se contraem juntos, mantendo o equilíbrio estratégico.
O MACD fornece temporização de entrada, enquanto as Bollinger Bands gerenciam completamente os níveis de saída. Essa separação de responsabilidades cria um sistema robusto onde a lógica de entrada e saída opera de forma independente, permitindo a otimização de cada componente sem afetar o outro.
Reproduzir o exemplo
Você pode importar este exemplo diretamente ou configurá-lo manualmente. Para replicar manualmente o módulo de trading, certifique-se de que um módulo recém-adicionado inclua as seguintes configurações principais e que o modo profissional esteja ativado:
Trade Basics
- Operation type = Long
Signal Generation - Indicators (MACD Main line)
- Signal in use = On
- Signal used for = Entry
- Selected indicator = MACD
- Line index = Main line
- Draw in chart = On
- Drawing slot = 1
Signal Generation - Indicators (MACD Signal line)
- Signal in use = On
- Signal used for = Entry
- Selected indicator = MACD
- Line index = Signal line
- Draw in chart = On
- Drawing slot = 2
Signal Generation - Indicators (BB Lower)
- Signal in use = On
- Signal used for = Forward
- Selected indicator = BB
- Line index = Lower
- Draw in chart = On
- Drawing slot = 3
Signal Generation - Indicators (BB Upper)
- Signal in use = On
- Signal used for = Forward
- Selected indicator = BB
- Line index = Upper
- Draw in chart = On
- Drawing slot = 4
Signal Generation - Indicator Combinations (MACD Main line & MACD Signal line)
- Signal in use = On
- Signal used for = Entry
- Input indicator 1 = MACD (Main line)
- Input indicator 2 = MACD (Signal line)
- Value relation = Value x cross value x
Initial Stop Loss
- Selection = Indicator value
- Used indicator = BB (Lower)
Initial Take Profit
- Selection = Indicator value
- Used indicator = BB (Upper)
Capturas de tela
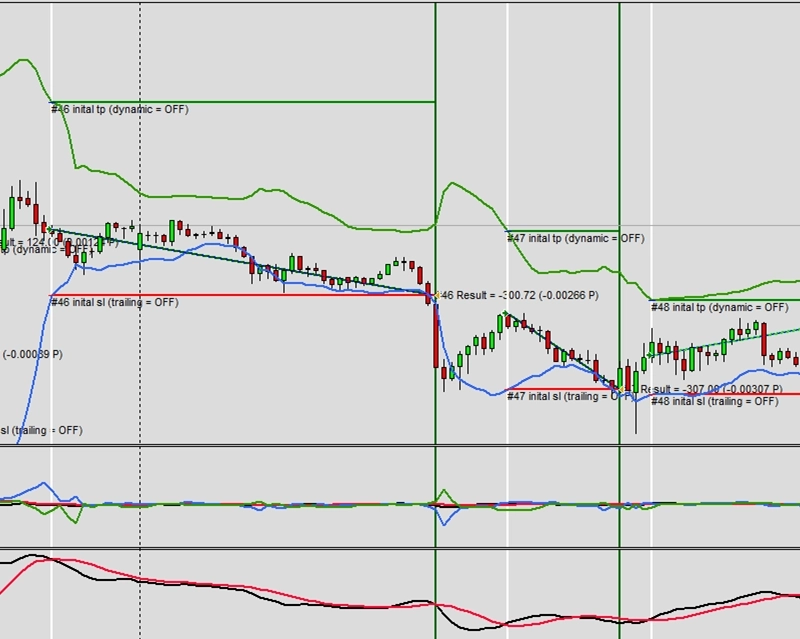
Exemplo D3: Valor de indicador para Stop Loss inicial, trailing de Stop Loss, Take Profit inicial e Take Profit dinâmico
CAUTION
Esta não é uma estratégia de trading pronta para uso. Uma estratégia de trading requer ajuste do timeframe e do símbolo, além de backtesting rigoroso. O exemplo é destinado como base para sua própria estratégia personalizada e para ajudá-lo a se familiarizar com a aplicação web Expert Advisor Builder. Para importar e usar um exemplo, siga as instruções fornecidas aqui.
Descrição
Este exemplo combina níveis baseados em indicadores com ajustes dinâmicos tanto para o Stop Loss quanto para o Take Profit. As Bollinger Bands fornecem os níveis iniciais e continuam ajustando-os durante toda a duração da operação. Isso cria um sistema totalmente dinâmico onde tanto o risco quanto os alvos de recompensa respondem às condições de mercado em mudança.
O trailing stop e o Take Profit dinâmico são ativados imediatamente, reposicionando-se continuamente com base nos valores atuais das Bollinger Bands. À medida que as bandas se expandem ou se contraem, ambos os níveis se ajustam de acordo. Isso cria um sistema de gestão de operação que respira e se adapta à volatilidade em tempo real.
Essa abordagem avançada é adequada para traders experientes que se sentem confortáveis com a gestão de posição totalmente automatizada. O sistema não requer intervenção manual depois que as operações são abertas, tornando-o ideal para trading algorítmico.
Reproduzir o exemplo
Você pode importar este exemplo diretamente ou configurá-lo manualmente. Para replicar manualmente o módulo de trading, certifique-se de que um módulo recém-adicionado inclua as seguintes configurações principais e que o modo profissional esteja ativado:
Trade Basics
- Operation type = Long
Signal Generation - Indicators (MACD Main line)
- Signal in use = On
- Signal used for = Entry
- Selected indicator = MACD
- Line index = Main line
- Draw in chart = On
- Drawing slot = 1
Signal Generation - Indicators (MACD Signal line)
- Signal in use = On
- Signal used for = Entry
- Selected indicator = MACD
- Line index = Signal line
- Draw in chart = On
- Drawing slot = 2
Signal Generation - Indicators (BB Lower)
- Signal in use = On
- Signal used for = Forward
- Selected indicator = BB
- Line index = Lower
- Draw in chart = On
- Drawing slot = 3
Signal Generation - Indicators (BB Upper)
- Signal in use = On
- Signal used for = Forward
- Selected indicator = BB
- Line index = Upper
- Draw in chart = On
- Drawing slot = 4
Signal Generation - Indicator Combinations (MACD Main line & MACD Signal line)
- Signal in use = On
- Signal used for = Entry
- Input indicator 1 = MACD (Main line)
- Input indicator 2 = MACD (Signal line)
- Value relation = Value x cross value x
Initial Stop Loss
- Selection = Indicator value
- Used indicator = BB (Lower)
Stop Loss Trailing - Indicator value
- Activation position = 0
- Type = Indicator value
- Used indicator = BB (Lower)
Initial Take Profit
- Selection = Indicator value
- Used indicator = BB (Upper)
Dynamic Take Profit - Indicator value
- Activation position = 0
- Type = Indicator value
- Used indicator = BB (Upper)
Capturas de tela
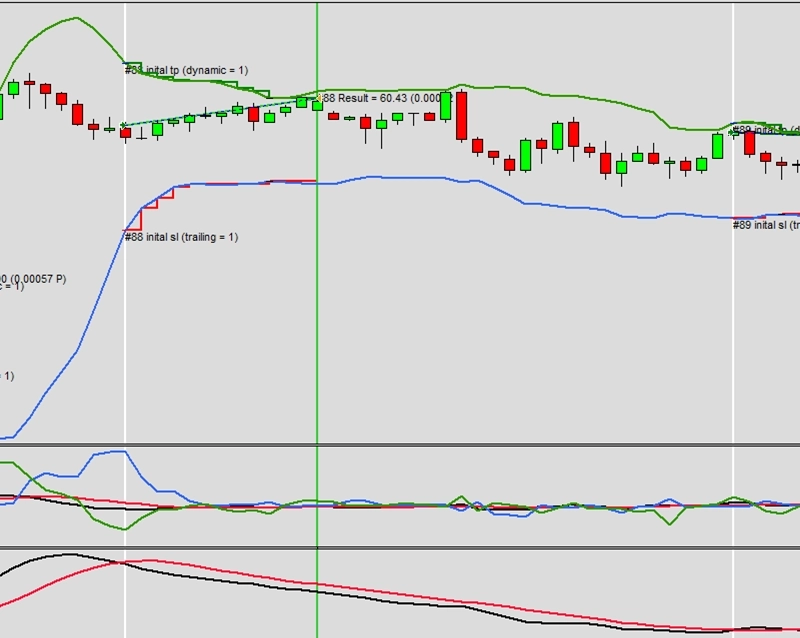
Exemplo D4: Suporte e resistência para Stop Loss inicial e Take Profit inicial
CAUTION
Esta não é uma estratégia de trading pronta para uso. Uma estratégia de trading requer ajuste do timeframe e do símbolo, além de backtesting rigoroso. O exemplo é destinado como base para sua própria estratégia personalizada e para ajudá-lo a se familiarizar com a aplicação web Expert Advisor Builder. Para importar e usar um exemplo, siga as instruções fornecidas aqui.
Descrição
Este exemplo usa os níveis de suporte e resistência do analisador de gráficos para o posicionamento de Stop Loss e Take Profit. O analisador identifica automaticamente os níveis de preço-chave, posicionando os stops abaixo do suporte para operações long e os alvos nos níveis de resistência. Os requisitos de distância mínima garantem que os níveis não fiquem muito próximos dos preços de entrada.
A taxa de variação mínima de 0,00250000 para Stop Loss e 0,00300000 para Take Profit cria espaçamento adequado dos preços de entrada. Essas mínimas evitam que o sistema use níveis de suporte ou resistência muito próximos, o que poderia resultar em saídas prematuras ou alvos irrealistas.
Os níveis baseados em gráficos frequentemente se alinham com pontos de preço psicológicos onde muitos traders colocam ordens. Isso cria profecias autorrealizáveis à medida que os preços reagem nesses níveis.
Reproduzir o exemplo
Você pode importar este exemplo diretamente ou configurá-lo manualmente. Para replicar manualmente o módulo de trading, certifique-se de que um módulo recém-adicionado inclua as seguintes configurações principais e que o modo profissional esteja ativado:
Trade Basics
- Operation type = Long
Signal Generation - Indicators (MACD Main line)
- Signal in use = On
- Signal used for = Entry
- Selected indicator = MACD
- Line index = Main line
- Draw in chart = On
- Drawing slot = 1
Signal Generation - Indicators (MACD Signal line)
- Signal in use = On
- Signal used for = Entry
- Selected indicator = MACD
- Line index = Signal line
- Draw in chart = On
- Drawing slot = 2
Signal Generation - Indicator Combinations (MACD Main line & MACD Signal line)
- Signal in use = On
- Signal used for = Entry
- Input indicator 1 = MACD (Main line)
- Input indicator 2 = MACD (Signal line)
- Value relation = Value x cross value x
Signal Generation - Chart Analyzer
- Signal in use = On
- Signal used for = Forward
- Draw boundaries = Off
- Draw extrema = Off
- Draw supports and resistances = On
- Draw swing phase = Off
- Supports and resistances forward = ALL
- Support multiplier = 1.00
- Resistance multiplier = 1.00
Initial Stop Loss
- Selection = Support/resistance from chart analyzer
- Used chart analyzer = Chart Analyzer
- Minimum value in fix pips = Off
- Minimum value in rate of change = 0.00250000
- Maximum value in fix pips = Off
- Maximum value in rate of change = Off
Initial Take Profit
- Selection = Support/resistance from chart analyzer
- Used chart analyzer = Chart Analyzer
- Minimum value in fix pips = Off
- Minimum value in rate of change = 0.00300000
- Maximum value in fix pips = Off
- Maximum value in rate of change = Off
Capturas de tela
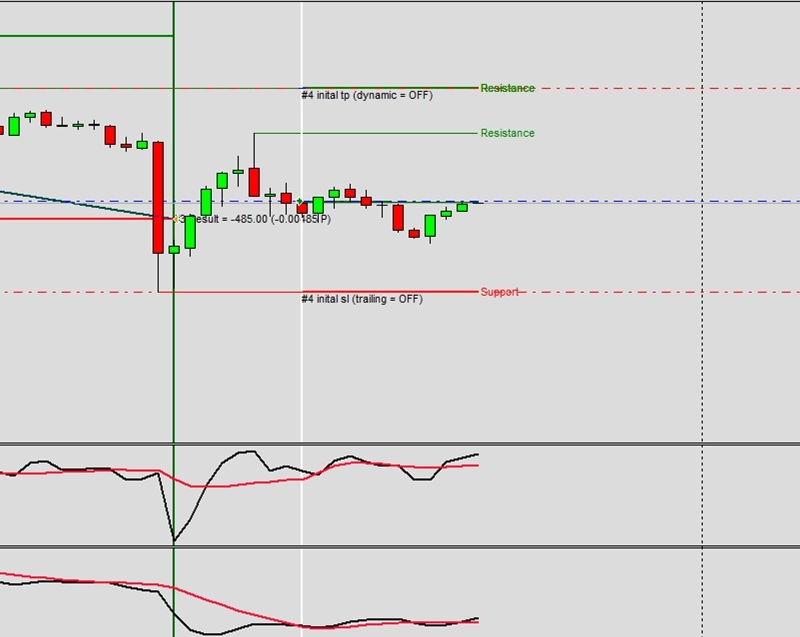
Exemplo D5: Suporte e resistência para Stop Loss inicial, trailing de Stop Loss, Take Profit inicial e Take Profit dinâmico
CAUTION
Esta não é uma estratégia de trading pronta para uso. Uma estratégia de trading requer ajuste do timeframe e do símbolo, além de backtesting rigoroso. O exemplo é destinado como base para sua própria estratégia personalizada e para ajudá-lo a se familiarizar com a aplicação web Expert Advisor Builder. Para importar e usar um exemplo, siga as instruções fornecidas aqui.
Descrição
Este exemplo estende o uso de suporte e resistência para incluir ajustes dinâmicos ao longo da duração da operação. Tanto os níveis de Stop Loss quanto os de Take Profit são atualizados continuamente à medida que novos níveis de suporte e resistência se formam. Isso cria um sistema inteligente que se adapta à estrutura de mercado em evolução.
O analisador de gráficos verifica continuamente novos níveis, mudando para o suporte ou resistência mais próximo à medida que eles se desenvolvem. Isso permite que as operações apertem os stops à medida que o preço se move favoravelmente, enquanto estendem os alvos quando a resistência é rompida. A exibição visual mostra todos os níveis detectados, fornecendo transparência na tomada de decisões.
Essa abordagem sofisticada imita como traders profissionais ajustam manualmente os níveis com base na estrutura de mercado. A automação garante aplicação consistente sem interferência emocional, mantendo gestão disciplinada de operações mesmo durante condições de mercado estressantes.
Reproduzir o exemplo
Você pode importar este exemplo diretamente ou configurá-lo manualmente. Para replicar manualmente o módulo de trading, certifique-se de que um módulo recém-adicionado inclua as seguintes configurações principais e que o modo profissional esteja ativado:
Trade Basics
- Operation type = Long
Signal Generation - Indicators (MACD Main line)
- Signal in use = On
- Signal used for = Entry
- Selected indicator = MACD
- Line index = Main line
- Draw in chart = On
- Drawing slot = 1
Signal Generation - Indicators (MACD Signal line)
- Signal in use = On
- Signal used for = Entry
- Selected indicator = MACD
- Line index = Signal line
- Draw in chart = On
- Drawing slot = 2
Signal Generation - Indicator Combinations (MACD Main line & MACD Signal line)
- Signal in use = On
- Signal used for = Entry
- Input indicator 1 = MACD (Main line)
- Input indicator 2 = MACD (Signal line)
- Value relation = Value x cross value x
Signal Generation - Chart Analyzer
- Signal in use = On
- Signal used for = Forward
- Draw boundaries = Off
- Draw extrema = Off
- Draw supports and resistances = On
- Draw swing phase = Off
- Supports and resistances forward = ALL
- Support multiplier = 1.00
- Resistance multiplier = 1.00
Initial Stop Loss
- Selection = Support/resistance from chart analyzer
- Used chart analyzer = Chart Analyzer
- Minimum value in fix pips = Off
- Minimum value in rate of change = 0.00250000
- Maximum value in fix pips = Off
- Maximum value in rate of change = Off
Stop Loss Trailing - Support/resistance from chart analyzer
- Activation position = 0
- Type = Support/resistance from chart analyzer
- Used chart analyzer = Chart Analyzer
- Support/resistance fix pips minimum = Off
- Support/resistance rate of change minimum = Off
- Support/resistance fix pips maximum = Off
- Support/resistance rate of change maximum = Off
Initial Take Profit
- Selection = Support/resistance from chart analyzer
- Used chart analyzer = Chart Analyzer
- Minimum value in fix pips = Off
- Minimum value in rate of change = 0.00300000
- Maximum value in fix pips = Off
- Maximum value in rate of change = Off
Dynamic Take Profit - Support/resistance from chart analyzer
- Activation position = 0
- Type = Support/resistance from chart analyzer
- Used chart analyzer = Chart Analyzer
- Support/resistance fix pips minimum = Off
- Support/resistance rate of change minimum = Off
- Support/resistance fix pips maximum = Off
- Support/resistance rate of change maximum = Off
Capturas de tela
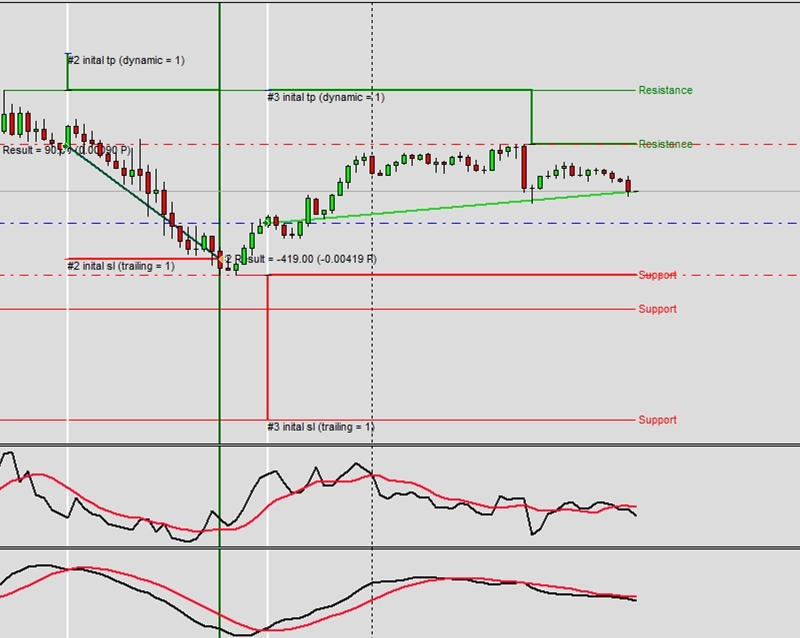
Exemplo D6: Busca por padrões de velas usada para Stop Loss inicial e Take Profit inicial
CAUTION
Esta não é uma estratégia de trading pronta para uso. Uma estratégia de trading requer ajuste do timeframe e do símbolo, além de backtesting rigoroso. O exemplo é destinado como base para sua própria estratégia personalizada e para ajudá-lo a se familiarizar com a aplicação web Expert Advisor Builder. Para importar e usar um exemplo, siga as instruções fornecidas aqui.
Descrição
Este exemplo usa reconhecimento de padrões de velas para determinar os níveis ideais de Stop Loss e Take Profit. Quando padrões como martelos ou formações envolventes ocorrem, eles fornecem níveis de saída ideais baseados na estrutura do padrão. O ajuste de encaminhamento de 2,00 permite o ajuste fino desses níveis idealizados.
Múltiplos padrões são ativados, aumentando a frequência dos sinais e fornecendo diversas oportunidades de entrada. Cada padrão tem características específicas que sugerem comportamento provável do preço, tornando-os valiosos para a determinação do nível de saída. A identificação visual de padrões ajuda os traders a aprender o reconhecimento de padrões enquanto o sistema opera automaticamente.
As saídas baseadas em padrões se alinham com os princípios da análise técnica tradicional, usando os mesmos conceitos que os traders manuais têm empregado por décadas. Isso aproxima as técnicas clássicas de gráficos do trading algorítmico moderno.
CAUTION
Recomendado usar M1 - M15
Reproduzir o exemplo
Você pode importar este exemplo diretamente ou configurá-lo manualmente. Para replicar manualmente o módulo de trading, certifique-se de que um módulo recém-adicionado inclua as seguintes configurações principais e que o modo profissional esteja ativado:
Trade Basics
- Operation type = Long
- One trade mode = Off
Signal Generation - Candle Patterns
- Signal in use = On
- Signal used for = Entry
- Hammer = On
- Hanging Man = On
- Bullish Belt Hold = On
- Bearish Belt Hold = On
- Bullish Engulfing = On
- Bearish Engulfing = On
- Bullish Harami = On
- Bearish Harami = On
- Bullish Harami Cross = On
- Bearish Harami Cross = On
- Bullish Doji = On
- Bearish Doji = On
- Bullish Long Legged Doji = On
- Bearish Long Legged Doji = On
- Bullish Gravestone Doji = On
- Bearish Gravestone Doji = On
- Bullish Dragonfly Doji = On
- Bearish Dragonfly Doji = On
- Dark Cloud Cover = On
- Piercing Pattern = On
- Morning Star = On
- Evening Star = On
- Bullish Inside Days = On
- Bearish Inside Days = On
- Stop loss forward adjustment = 2.00
- Take profit forward adjustment = 2.00
Initial Stop Loss
- Selection = Candle patterns
Initial Take Profit
- Selection = Candle patterns
Capturas de tela
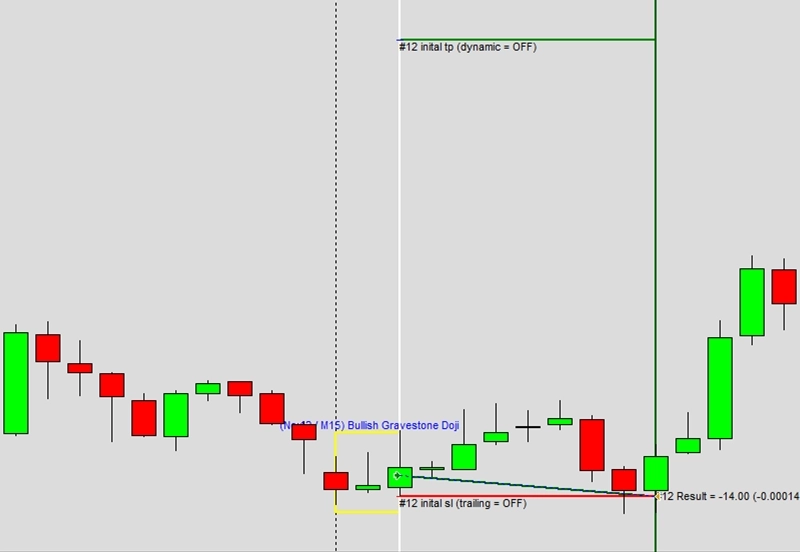
Exemplo D7: Busca por padrões de gráficos usada para Stop Loss inicial e Take Profit inicial
CAUTION
Esta não é uma estratégia de trading pronta para uso. Uma estratégia de trading requer ajuste do timeframe e do símbolo, além de backtesting rigoroso. O exemplo é destinado como base para sua própria estratégia personalizada e para ajudá-lo a se familiarizar com a aplicação web Expert Advisor Builder. Para importar e usar um exemplo, siga as instruções fornecidas aqui.
Descrição
Este exemplo emprega a detecção de padrões de gráficos para gestão de operações. Padrões como triângulos, ombro-cabeça-ombro e topos duplos fornecem níveis de saída estruturados baseados em movimentos mensurados. O ajuste de encaminhamento de 1,00 significa que os níveis ideais dos padrões são usados sem modificação, confiando nos princípios clássicos da análise técnica.
Dezoito padrões diferentes são ativados, cobrindo formações de continuação e reversão. Cada padrão tem alvos de lucro bem estabelecidos baseados na altura ou largura do padrão, fornecendo níveis de saída objetivos. O sistema reconhece esses padrões automaticamente, eliminando a interpretação subjetiva.
Os padrões de gráficos representam a psicologia da multidão visualizada na ação de preço. Usá-los para gestão de operações alinha as estratégias com esses níveis psicológicos onde atividade de trading significativa frequentemente ocorre, aumentando a probabilidade de saídas bem-sucedidas.
CAUTION
Recomendado usar M1 - M15
Reproduzir o exemplo
Você pode importar este exemplo diretamente ou configurá-lo manualmente. Para replicar manualmente o módulo de trading, certifique-se de que um módulo recém-adicionado inclua as seguintes configurações principais e que o modo profissional esteja ativado:
Trade Basics
- Operation type = Long
- One trade mode = Off
Signal Generation - Chart Patterns
- Signal in use = On
- Signal used for = Entry
- Bullish Wedge = On
- Bearish Wedge = On
- Bullish Trendchannel = On
- Bearish Trendchannel = On
- Bullish Triangle = On
- Bearish Triangle = On
- Shoulder Head Shoulder Top = On
- Shoulder Head Shoulder Bottom = On
- Double Top = On
- Double Bottom = On
- Triple Top = On
- Triple Bottom = On
- Rectangle Top = On
- Rectangle Bottom = On
- Bullish Symetric Triangle = On
- Bearish Symetric Triangle = On
- Bullish Gap = On
- Bearish Gap = On
- Stop loss forward adjustment = 1.00
- Take profit forward adjustment = 1.00
Initial Stop Loss
- Selection = Chart patterns
Initial Take Profit
- Selection = Chart patterns
Capturas de tela
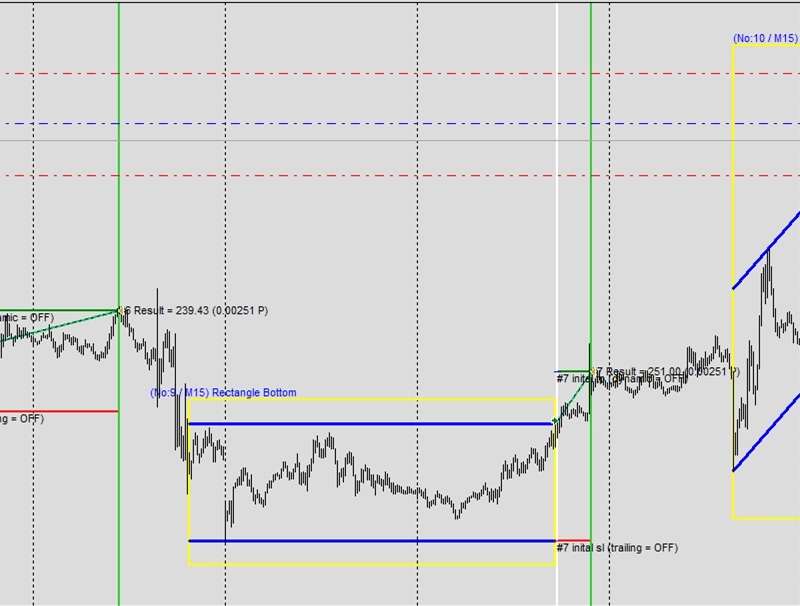
Exemplo D8: Busca por padrões de Fibonacci usada para Stop Loss inicial e Take Profit inicial
CAUTION
Esta não é uma estratégia de trading pronta para uso. Uma estratégia de trading requer ajuste do timeframe e do símbolo, além de backtesting rigoroso. O exemplo é destinado como base para sua própria estratégia personalizada e para ajudá-lo a se familiarizar com a aplicação web Expert Advisor Builder. Para importar e usar um exemplo, siga as instruções fornecidas aqui.
Descrição
Este exemplo utiliza padrões de retração de Fibonacci para gestão de operações. Quando padrões de Fibonacci de alta ou de baixa se formam, eles fornecem níveis naturais de Stop Loss e Take Profit baseados em percentuais de retração-chave. Essas relações matemáticas frequentemente criam zonas fortes de suporte e resistência.
O ajuste de encaminhamento de 1,00 indica que os níveis de Fibonacci são usados exatamente como calculados, respeitando a precisão matemática que essas razões representam. Os traders têm observado esses níveis por décadas, criando comportamento de preço autorreforçado em pontos-chave de Fibonacci.
O gerenciamento baseado em Fibonacci é adequado para estratégias de seguimento de tendência onde as retrações oferecem oportunidades de entrada. O reconhecimento de padrões elimina o desenho manual de Fibonacci, garantindo aplicação consistente em todas as operações enquanto mantém a integridade matemática desses níveis clássicos.
CAUTION
Recomendado usar M1 - M15
Reproduzir o exemplo
Você pode importar este exemplo diretamente ou configurá-lo manualmente. Para replicar manualmente o módulo de trading, certifique-se de que um módulo recém-adicionado inclua as seguintes configurações principais e que o modo profissional esteja ativado:
Trade Basics
- Operation type = Long
- One trade mode = Off
Signal Generation - Fibonacci Patterns
- Signal in use = On
- Signal used for = Entry
- Bullish Fibonacci = On
- Bearish Fibonacci = On
- Stop loss forward adjustment = 1.00
- Take profit forward adjustment = 1.00
Initial Stop Loss
- Selection = Fibonacci patterns
Initial Take Profit
- Selection = Fibonacci patterns
Capturas de tela
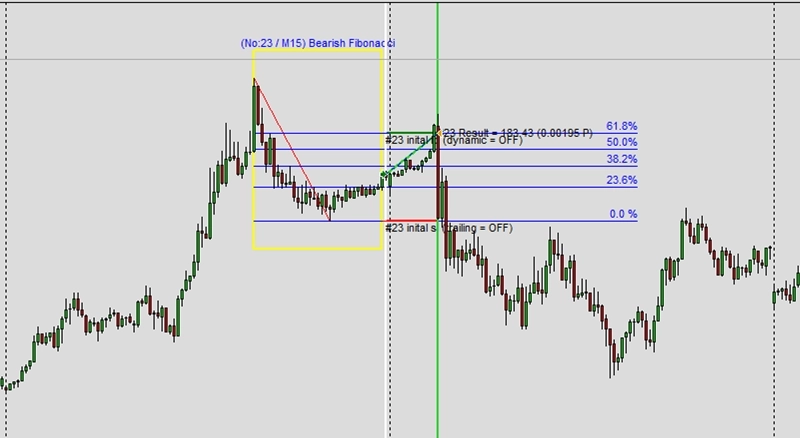
Exemplo E1: Duas operações com uma ordem pendente
CAUTION
Esta não é uma estratégia de trading pronta para uso. Uma estratégia de trading requer ajuste do timeframe e do símbolo, além de backtesting rigoroso. O exemplo é destinado como base para sua própria estratégia personalizada e para ajudá-lo a se familiarizar com a aplicação web Expert Advisor Builder. Para importar e usar um exemplo, siga as instruções fornecidas aqui.
Descrição
Este exemplo demonstra a divisão de operações com ordens pendentes. O sistema abre duas posições a partir de cada sinal: 100% do volume imediatamente e outros 50% em 80% do risco. Essa abordagem de entrada graduada permite adicionar a posições vencedoras enquanto limita a exposição em operações perdedoras.
A ordem pendente usa a mecânica de stop order com precificação baseada em Desvio Padrão. Se o preço se mover para 80% do risco, a posição adicional dispara automaticamente. Ambas as posições compartilham a mesma lógica de Stop Loss e Take Profit, simplificando o gerenciamento apesar de múltiplas entradas.
O escalonamento de posição representa gestão de dinheiro profissional, permitindo que os traders maximizem oportunidades lucrativas enquanto controlam o risco. Essa abordagem captura mais lucro de movimentos fortes enquanto mantém exposição razoável em sinais falhos.
Reproduzir o exemplo
Você pode importar este exemplo diretamente ou configurá-lo manualmente. Para replicar manualmente o módulo de trading, certifique-se de que um módulo recém-adicionado inclua as seguintes configurações principais e que o modo profissional esteja ativado:
Trade Basics
- Operation type = Long
- Pending Order Settings
- Mode = Stop
- Price calculation method = Indicator value
- Used indicator = STD
- Expiration = 75
Signal Generation - Indicators - STD
- Signal in use = On
- Signal used for = Forward
- Selected indicator = STD
- Draw in chart = Off
- Forward adjustment = 3.50
Signal Generation - Indicators (MACD Main line)
- Signal in use = On
- Signal used for = Entry
- Selected indicator = MACD
- Line index = Main line
- Draw in chart = On
- Drawing slot = 1
Signal Generation - Indicators (MACD Signal line)
- Signal in use = On
- Signal used for = Entry
- Selected indicator = MACD
- Line index = Signal line
- Draw in chart = On
- Drawing slot = 2
Signal Generation - Indicator Combinations (MACD Main line & MACD Signal line)
- Signal in use = On
- Signal used for = Entry
- Input indicator 1 = MACD (Main line)
- Input indicator 2 = MACD (Signal line)
- Value relation = Value 1 cross value 2
Initial Stop Loss
- Selection = Indicator
- Used indicator = STD
Initial Take Profit
- Selection = Risk ratio
- Risk ratio = 1.40
Trade Splitting
- Open volume = 100
- Open position = 80
- Close position = 0
Capturas de tela
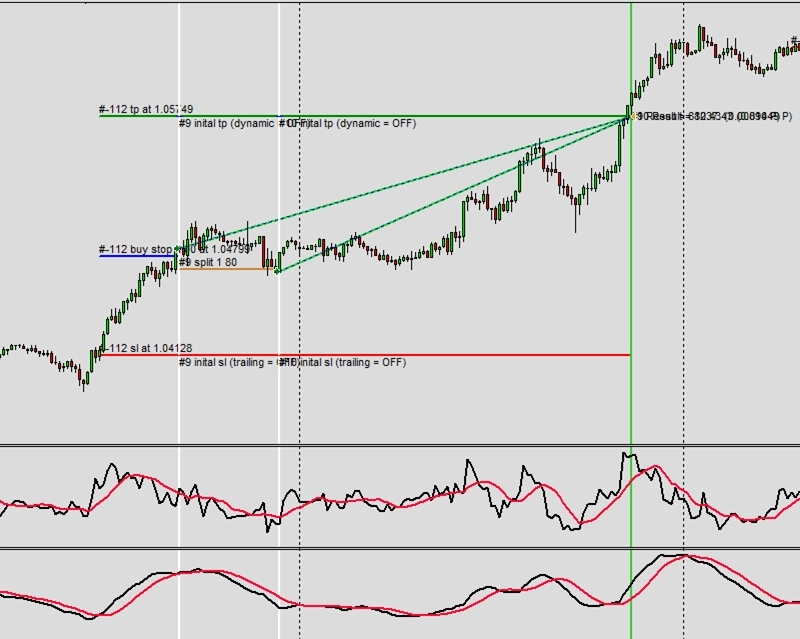
Exemplo E2: Três operações
CAUTION
Esta não é uma estratégia de trading pronta para uso. Uma estratégia de trading requer ajuste do timeframe e do símbolo, além de backtesting rigoroso. O exemplo é destinado como base para sua própria estratégia personalizada e para ajudá-lo a se familiarizar com a aplicação web Expert Advisor Builder. Para importar e usar um exemplo, siga as instruções fornecidas aqui.
Descrição
Este exemplo estende a divisão de operações para três posições com diferentes pontos de entrada e saída. A primeira divisão entra a 80% do risco com volume total, enquanto a segunda entra a 150% do risco com 50% do volume e sai a 200% do risco. Isso cria um sistema de escalonamento sofisticado com múltiplos alvos de lucro.
Cada divisão pode ter níveis de saída independentes, permitindo realização parcial de lucros em pontos predeterminados. Essa abordagem bloqueia os ganhos progressivamente enquanto mantém partes da posição para movimentos maiores. A operação principal visa um risk ratio de 2,40, buscando lucros substanciais na posição principal.
Múltiplos pontos de saída reduzem a pressão psicológica ao garantir lucros de forma incremental. Traders frequentemente lutam com saídas do tipo tudo ou nada; essa abordagem graduada fornece uma solução equilibrada que satisfaz tanto os instintos conservadores quanto os agressivos.
Reproduzir o exemplo
Você pode importar este exemplo diretamente ou configurá-lo manualmente. Para replicar manualmente o módulo de trading, certifique-se de que um módulo recém-adicionado inclua as seguintes configurações principais e que o modo profissional esteja ativado:
Trade Basics
- Operation type = Long
Signal Generation - Indicators - STD
- Signal in use = On
- Signal used for = Forward
- Selected indicator = STD
- Draw in chart = Off
- Forward adjustment = 3.50
Signal Generation - Indicators (MACD Main line)
- Signal in use = On
- Signal used for = Entry
- Selected indicator = MACD
- Line index = Main line
- Draw in chart = On
- Drawing slot = 1
Signal Generation - Indicators (MACD Signal line)
- Signal in use = On
- Signal used for = Entry
- Selected indicator = MACD
- Line index = Signal line
- Draw in chart = On
- Drawing slot = 2
Signal Generation - Indicator Combinations (MACD Main line & MACD Signal line)
- Signal in use = On
- Signal used for = Entry
- Input indicator 1 = MACD (Main line)
- Input indicator 2 = MACD (Signal line)
- Value relation = Value 1 cross value 2
Initial Stop Loss
- Selection = Indicator
- Used indicator = STD
Initial Take Profit
- Selection = Risk ratio
- Risk ratio = 2.40
Trade Splitting 1
- Open volume = 100
- Open position = 80
- Close position = 0
Trade Splitting 2
- Open volume = 50
- Open position = 150
- Close position = 200
Capturas de tela
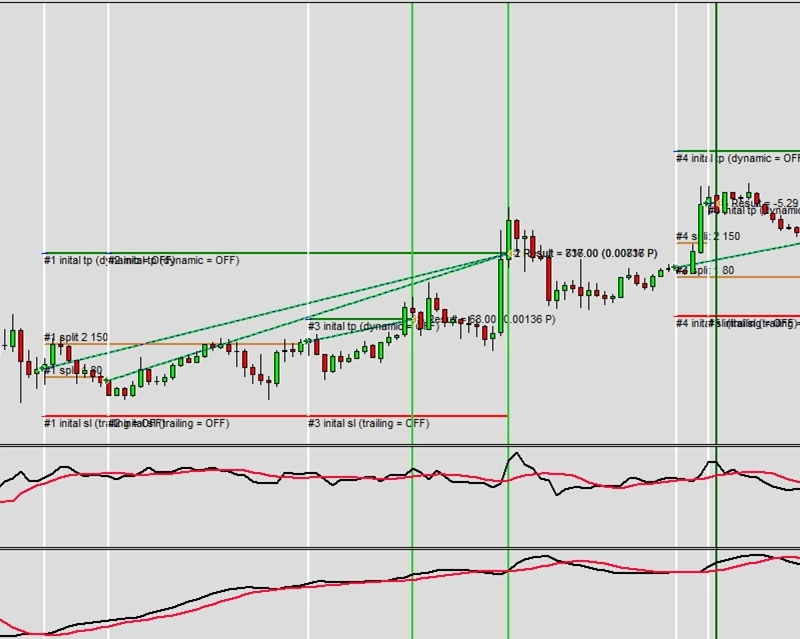
Exemplo E3: Quatro operações
CAUTION
Esta não é uma estratégia de trading pronta para uso. Uma estratégia de trading requer ajuste do timeframe e do símbolo, além de backtesting rigoroso. O exemplo é destinado como base para sua própria estratégia personalizada e para ajudá-lo a se familiarizar com a aplicação web Expert Advisor Builder. Para importar e usar um exemplo, siga as instruções fornecidas aqui.
Descrição
Este exemplo implementa a divisão de quatro posições, criando uma estratégia de escalonamento complexa. Cada divisão tem pontos de entrada e volumes específicos, com a posição final usando apenas 25% do volume entrando a 200% do risco. Essa abordagem piramidal maximiza o tamanho da posição em operações vencedoras enquanto minimiza o risco.
As entradas escalonadas a 80, 150 e 200% do risco criam múltiplos pontos de confirmação antes da implantação total da posição. Saídas antecipadas a 200 e 220% do risco para divisões posteriores garantem a realização de lucros mesmo se as tendências reverterem. Essa estrutura sofisticada equilibra agressividade com proteção.
A divisão em quatro níveis representa gestão avançada de posição adequada para mercados fortemente em tendência. A complexidade requer monitoramento cuidadoso, mas pode aprimorar significativamente a lucratividade quando as tendências persistem além dos alvos iniciais.
Reproduzir o exemplo
Você pode importar este exemplo diretamente ou configurá-lo manualmente. Para replicar manualmente o módulo de trading, certifique-se de que um módulo recém-adicionado inclua as seguintes configurações principais e que o modo profissional esteja ativado:
Trade Basics
- Operation type = Long
Signal Generation - Indicators - STD
- Signal in use = On
- Signal used for = Forward
- Selected indicator = STD
- Draw in chart = Off
- Forward adjustment = 3.50
Signal Generation - Indicators (MACD Main line)
- Signal in use = On
- Signal used for = Entry
- Selected indicator = MACD
- Line index = Main line
- Draw in chart = On
- Drawing slot = 1
Signal Generation - Indicators (MACD Signal line)
- Signal in use = On
- Signal used for = Entry
- Selected indicator = MACD
- Line index = Signal line
- Draw in chart = On
- Drawing slot = 2
Signal Generation - Indicator Combinations (MACD Main line & MACD Signal line)
- Signal in use = On
- Signal used for = Entry
- Input indicator 1 = MACD (Main line)
- Input indicator 2 = MACD (Signal line)
- Value relation = Value 1 cross value 2
Initial Stop Loss
- Selection = Indicator
- Used indicator = STD
Initial Take Profit
- Selection = Risk ratio
- Risk ratio = 2.40
Trade Splitting 1
- Open volume = 100
- Open position = 80
- Close position = 0
Trade Splitting 2
- Open volume = 50
- Open position = 150
- Close position = 200
Trade Splitting 3
- Open volume = 25
- Open position = 200
- Close position = 220
Capturas de tela
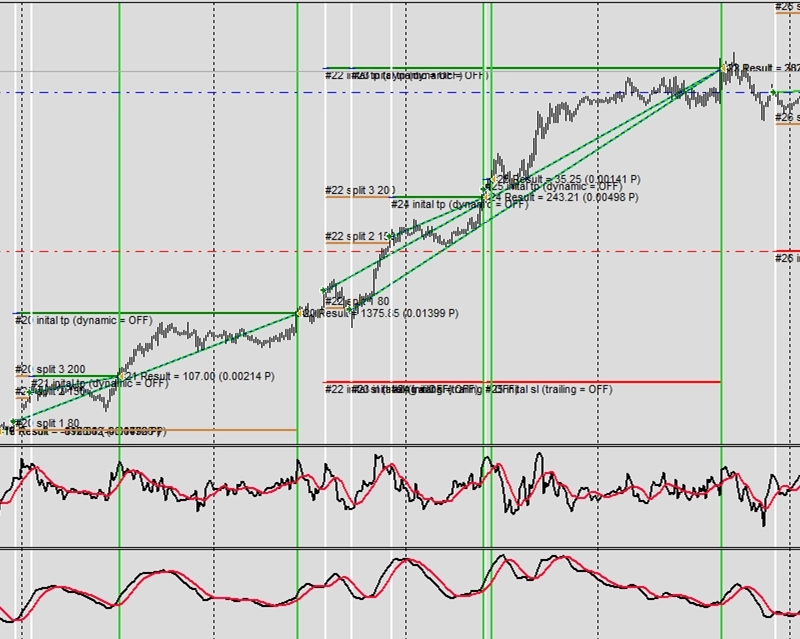
Exemplo F1: Desativação temporária do trading por mau desempenho
CAUTION
Esta não é uma estratégia de trading pronta para uso. Uma estratégia de trading requer ajuste do timeframe e do símbolo, além de backtesting rigoroso. O exemplo é destinado como base para sua própria estratégia personalizada e para ajudá-lo a se familiarizar com a aplicação web Expert Advisor Builder. Para importar e usar um exemplo, siga as instruções fornecidas aqui.
Descrição
Este exemplo mostra a suspensão temporária do trading devido a mau desempenho semanal. Se a conta cair 2% ou mais em uma semana, o trading é interrompido até que a próxima semana comece. O painel do inspetor exibe as métricas de desempenho atuais, fornecendo feedback em tempo real sobre a proximidade dos limites de suspensão.
Esse mecanismo de proteção evita o trading emocional de vingança após perdas. Ao forçar um período de reflexão, os traders podem analisar o que deu errado sem arriscar mais capital. A redefinição automática a cada semana fornece novos começos sem intervenção manual.
O monitoramento de desempenho cria sistemas de trading autocientes que reconhecem quando as estratégias não estão funcionando. Esse recurso defensivo é inestimável durante condições de mercado inesperadas quando as estratégias podem temporariamente falhar.
Reproduzir o exemplo
Você pode importar este exemplo diretamente ou configurá-lo manualmente. Para replicar manualmente o módulo de trading, certifique-se de que um módulo recém-adicionado inclua as seguintes configurações principais e que o modo profissional esteja ativado:
Trade Basics
- Operation type = Long
- One trade mode = Off
Signal Generation - Indicators - STD
- Signal in use = On
- Signal used for = Forward
- Selected indicator = STD
- Draw in chart = Off
- Forward adjustment = 3.50
Signal Generation - Indicators - SMA
- Signal in use = On
- Signal used for = Entry
- Selected indicator = SMA
- Draw in chart = On
- Drawing slot = 1
Signal Generation - Indicators - EMA
- Signal in use = On
- Signal used for = Entry
- Selected indicator = EMA
- Draw in chart = On
- Drawing slot = 2
Signal Generation - Indicator Combinations (SMA & EMA)
- Signal in use = On
- Signal used for = Entry
- Input indicator 1 = SMA
- Input indicator 2 = EMA
- Value relation = Value x cross value x
Initial Stop Loss
- Selection = Indicator
- Used indicator = STD
Initial Take Profit
- Selection = Risk ratio
- Risk ratio = 1.40
Volume Calculation
- Volume calculation method = Fix lots
- Fix lots = 0.10
Monitoring
- Draw inspector panel = On
- Weekly performance: Relative lower limit = -2.00
Capturas de tela
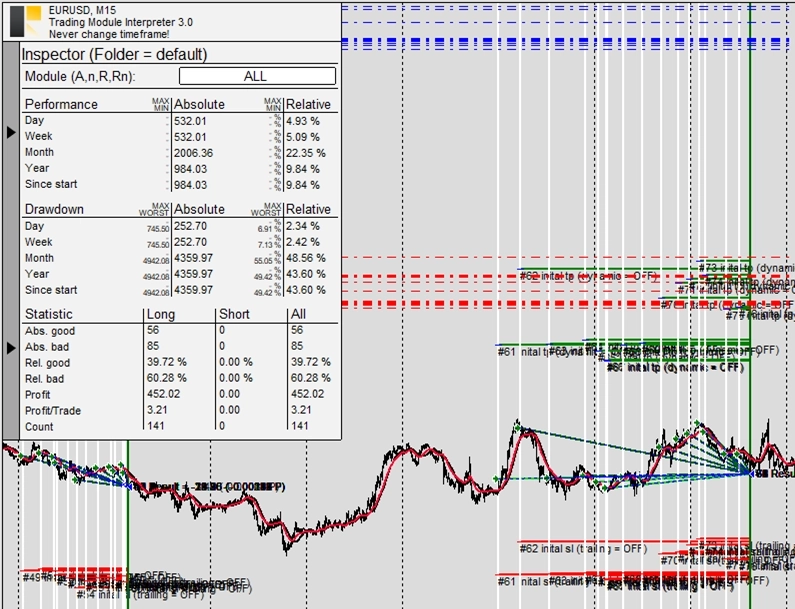
Exemplo F2: Desativação permanente do trading por mau desempenho
CAUTION
Esta não é uma estratégia de trading pronta para uso. Uma estratégia de trading requer ajuste do timeframe e do símbolo, além de backtesting rigoroso. O exemplo é destinado como base para sua própria estratégia personalizada e para ajudá-lo a se familiarizar com a aplicação web Expert Advisor Builder. Para importar e usar um exemplo, siga as instruções fornecidas aqui.
Descrição
Este exemplo implementa a suspensão permanente do trading com base no desempenho geral. Se o desempenho total da conta cair abaixo do limiar de -2%, o trading para completamente sem reativação automática. Essa proteção final evita a destruição completa da conta durante falhas de estratégia.
O painel do inspetor exibe continuamente as métricas de desempenho geral, avisando os traders à medida que se aproximam do limiar de suspensão permanente. Essa transparência permite a intervenção antes do desligamento automático. A redefinição manual ainda é possível, mas requer ação deliberada.
A suspensão permanente representa a última rede de segurança, reconhecendo que as estratégias podem falhar completamente. Essa abordagem humilde aceita que nem todas as estratégias funcionam para sempre, protegendo o capital quando os pressupostos fundamentais da estratégia se quebram.
Reproduzir o exemplo
Você pode importar este exemplo diretamente ou configurá-lo manualmente. Para replicar manualmente o módulo de trading, certifique-se de que um módulo recém-adicionado inclua as seguintes configurações principais e que o modo profissional esteja ativado:
Trade Basics
- Operation type = Long
- One trade mode = Off
Signal Generation - Indicators - STD
- Signal in use = On
- Signal used for = Forward
- Selected indicator = STD
- Draw in chart = Off
- Forward adjustment = 3.50
Signal Generation - Indicators - SMA
- Signal in use = On
- Signal used for = Entry
- Selected indicator = SMA
- Draw in chart = On
- Drawing slot = 1
Signal Generation - Indicators - EMA
- Signal in use = On
- Signal used for = Entry
- Selected indicator = EMA
- Draw in chart = On
- Drawing slot = 2
Signal Generation - Indicator Combinations (SMA & EMA)
- Signal in use = On
- Signal used for = Entry
- Input indicator 1 = SMA
- Input indicator 2 = EMA
- Value relation = Value x cross value x
Initial Stop Loss
- Selection = Indicator
- Used indicator = STD
Initial Take Profit
- Selection = Risk ratio
- Risk ratio = 1.40
Volume Calculation
- Volume calculation method = Fix lots
- Fix lots = 0.10
Monitoring
- Draw inspector panel = On
- Overall performance: Relative lower limit = 2.00
Capturas de tela
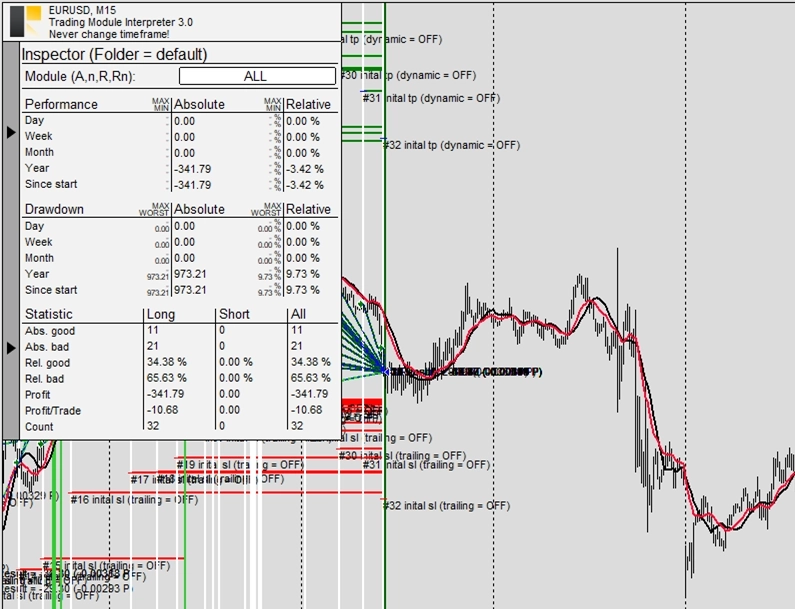
Exemplo F3: Desativação temporária do trading por drawdown excessivo
CAUTION
Esta não é uma estratégia de trading pronta para uso. Uma estratégia de trading requer ajuste do timeframe e do símbolo, além de backtesting rigoroso. O exemplo é destinado como base para sua própria estratégia personalizada e para ajudá-lo a se familiarizar com a aplicação web Expert Advisor Builder. Para importar e usar um exemplo, siga as instruções fornecidas aqui.
Descrição
Este exemplo usa limites de drawdown semanal para suspensão temporária. Se o drawdown exceder 2% em uma semana, o trading pausa até a próxima semana. Ao contrário dos limites de desempenho que medem resultados finais, os limites de drawdown monitoram os movimentos de pico a vale durante o período.
O monitoramento de drawdown captura a exposição ao risco com mais precisão do que simples métricas de desempenho. Uma estratégia pode terminar lucrativamente enquanto experimenta drawdowns perigosos que arriscam grandes perdas. Essa medição garante que as estratégias mantenham níveis de risco aceitáveis ao longo dos períodos de trading.
O painel do inspetor mostra os níveis atuais de drawdown, ajudando os traders a entender sua exposição ao risco em tempo real. Essa consciência promove melhores decisões de gestão de risco mesmo ao operar manualmente junto com sistemas automatizados.
Reproduzir o exemplo
Você pode importar este exemplo diretamente ou configurá-lo manualmente. Para replicar manualmente o módulo de trading, certifique-se de que um módulo recém-adicionado inclua as seguintes configurações principais e que o modo profissional esteja ativado:
Trade Basics
- Operation type = Long
- One trade mode = Off
Signal Generation - Indicators - STD
- Signal in use = On
- Signal used for = Forward
- Selected indicator = STD
- Draw in chart = Off
- Forward adjustment = 3.50
Signal Generation - Indicators - SMA
- Signal in use = On
- Signal used for = Entry
- Selected indicator = SMA
- Draw in chart = On
- Drawing slot = 1
Signal Generation - Indicators - EMA
- Signal in use = On
- Signal used for = Entry
- Selected indicator = EMA
- Draw in chart = On
- Drawing slot = 2
Signal Generation - Indicator Combinations (SMA & EMA)
- Signal in use = On
- Signal used for = Entry
- Input indicator 1 = SMA
- Input indicator 2 = EMA
- Value relation = Value x cross value x
Initial Stop Loss
- Selection = Indicator
- Used indicator = STD
Initial Take Profit
- Selection = Risk ratio
- Risk ratio = 1.40
Volume Calculation
- Volume calculation method = Fix lots
- Fix lots = 0.10
Monitoring
- Draw inspector panel = On
- Weekly drawdown : Relative upper limit = 2.00
Capturas de tela
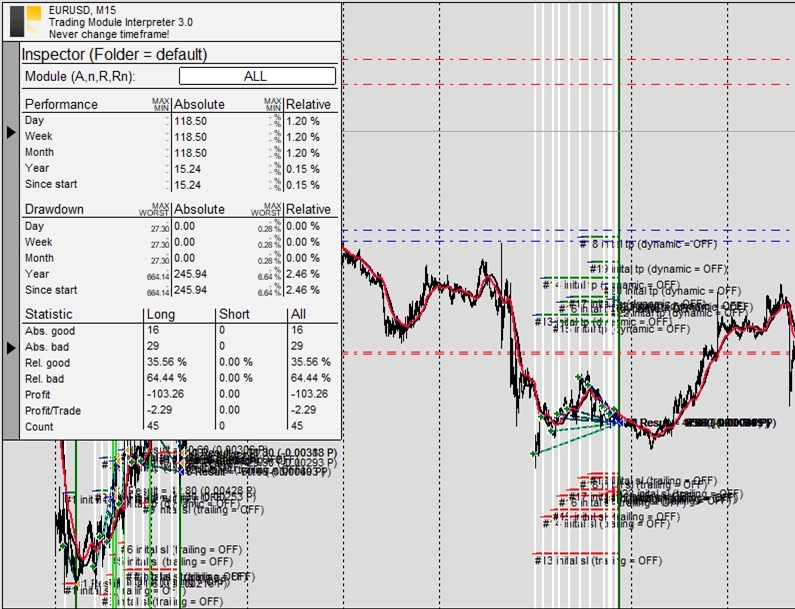
Exemplo F4: Desativação permanente do trading por drawdown excessivo
CAUTION
Esta não é uma estratégia de trading pronta para uso. Uma estratégia de trading requer ajuste do timeframe e do símbolo, além de backtesting rigoroso. O exemplo é destinado como base para sua própria estratégia personalizada e para ajudá-lo a se familiarizar com a aplicação web Expert Advisor Builder. Para importar e usar um exemplo, siga as instruções fornecidas aqui.
Descrição
Este exemplo impõe suspensão permanente com base no drawdown máximo geral. Se o drawdown exceder 2% do maior patrimônio da conta, o trading para permanentemente. Essa proteção rigorosa garante que as estratégias nunca arrisquem perdas inaceitáveis independentemente de eventual recuperação.
O drawdown geral representa o pior cenário experimentado desde o início da estratégia. Essa métrica revela a verdadeira exposição ao risco, mostrando a perda máxima que os traders devem suportar psicológica e financeiramente. Limitar isso preserva tanto o capital quanto a confiança.
A natureza permanente dessa suspensão reflete as implicações sérias do drawdown. Estratégias que excedem níveis aceitáveis de drawdown provaram ser muito arriscadas, justificando uma reavaliação completa em vez de simples continuação.
Reproduzir o exemplo
Você pode importar este exemplo diretamente ou configurá-lo manualmente. Para replicar manualmente o módulo de trading, certifique-se de que um módulo recém-adicionado inclua as seguintes configurações principais e que o modo profissional esteja ativado:
Trade Basics
- Operation type = Long
- One trade mode = Off
Signal Generation - Indicators - STD
- Signal in use = On
- Signal used for = Forward
- Selected indicator = STD
- Draw in chart = Off
- Forward adjustment = 3.50
Signal Generation - Indicators - SMA
- Signal in use = On
- Signal used for = Entry
- Selected indicator = SMA
- Draw in chart = On
- Drawing slot = 1
Signal Generation - Indicators - EMA
- Signal in use = On
- Signal used for = Entry
- Selected indicator = EMA
- Draw in chart = On
- Drawing slot = 2
Signal Generation - Indicator Combinations (SMA & EMA)
- Signal in use = On
- Signal used for = Entry
- Input indicator 1 = SMA
- Input indicator 2 = EMA
- Value relation = Value x cross value x
Initial Stop Loss
- Selection = Indicator
- Used indicator = STD
Initial Take Profit
- Selection = Risk ratio
- Risk ratio = 1.40
Volume Calculation
- Volume calculation method = Fix lots
- Fix lots = 0.10
Monitoring
- Draw inspector panel = On
- Overall drawdown: Relative upper limit = 2.00
Capturas de tela
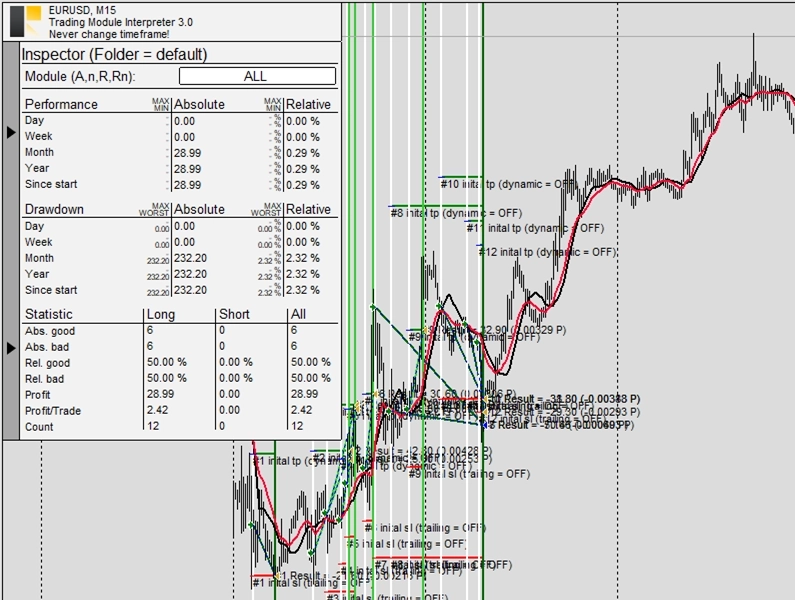
Exemplo G1: Buy stop e preço pendente com StdDev
CAUTION
Esta não é uma estratégia de trading pronta para uso. Uma estratégia de trading requer ajuste do timeframe e do símbolo, além de backtesting rigoroso. O exemplo é destinado como base para sua própria estratégia personalizada e para ajudá-lo a se familiarizar com a aplicação web Expert Advisor Builder. Para importar e usar um exemplo, siga as instruções fornecidas aqui.
Descrição
Este exemplo demonstra ordens pendentes de buy stop com precificação baseada em Desvio Padrão. As ordens são colocadas acima do preço atual de mercado usando o valor do indicador STD, disparando apenas se o preço subir até esse nível. A expiração de 75 barras garante que as ordens não permaneçam indefinidamente se não forem utilizadas.
As ordens stop se destacam em estratégias de breakout onde os traders querem confirmação do movimento ascendente antes de entrar. Ao aguardar o preço atingir o nível pendente, a estratégia evita falsos breakouts que imediatamente revertem. A precificação baseada em STD se adapta à volatilidade, colocando ordens em níveis estatisticamente significativos.
As ordens pendentes reduzem o slippage durante mercados rápidos pré-posicionando ordens nos níveis desejados. Isso é especialmente valioso durante eventos de notícias ou breakouts quando a execução imediata pode sofrer com preenchimentos ruins.
Reproduzir o exemplo
Você pode importar este exemplo diretamente ou configurá-lo manualmente. Para replicar manualmente o módulo de trading, certifique-se de que um módulo recém-adicionado inclua as seguintes configurações principais e que o modo profissional esteja ativado:
Trade Basics
- Operation type = Long
Pending Order Settings
- Mode = Stop
- Price calculation method = Indicator value
- Used indicator = STD
- Expiration = 75
Signal Generation - Indicators - STD
- Signal in use = On
- Signal used for = Forward
- Selected indicator = STD
- Draw in chart = Off
- Forward adjustment = 3.50
Signal Generation - Indicators (MACD Main line)
- Signal in use = On
- Signal used for = Entry
- Selected indicator = MACD
- Line index = Main line
- Draw in chart = On
- Drawing slot = 1
Signal Generation - Indicators (MACD Signal line)
- Signal in use = On
- Signal used for = Entry
- Selected indicator = MACD
- Line index = Signal line
- Draw in chart = On
- Drawing slot = 2
Signal Generation - Indicator Combinations (MACD Main line & MACD Signal line)
- Signal in use = On
- Signal used for = Entry
- Input indicator 1 = MACD (Main line)
- Input indicator 2 = MACD (Signal line)
- Value relation = Value 1 cross value 2
Initial Stop Loss
- Selection = Indicator
- Used indicator = STD
Initial Take Profit
- Selection = Risk ratio
- Risk ratio = 1.40
Capturas de tela
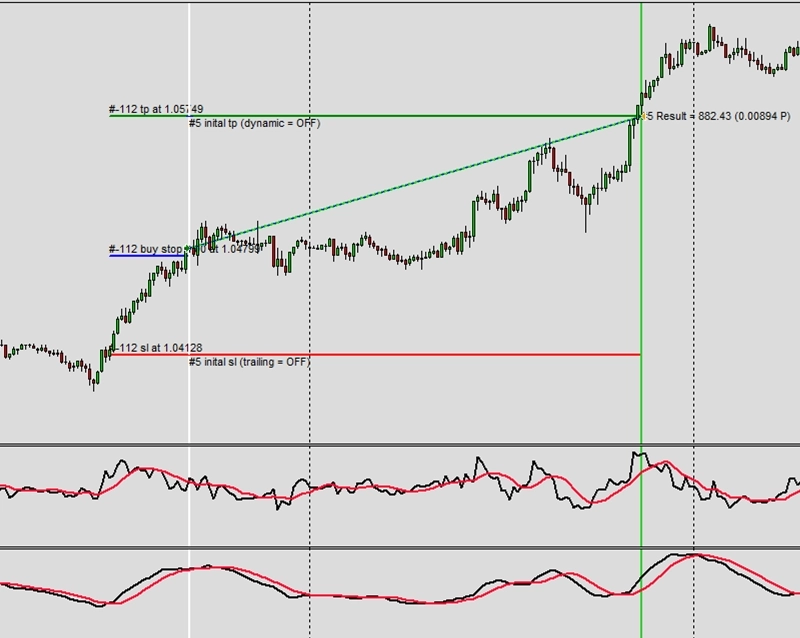
Exemplo G2: Buy limit e preço pendente com StdDev
CAUTION
Esta não é uma estratégia de trading pronta para uso. Uma estratégia de trading requer ajuste do timeframe e do símbolo, além de backtesting rigoroso. O exemplo é destinado como base para sua própria estratégia personalizada e para ajudá-lo a se familiarizar com a aplicação web Expert Advisor Builder. Para importar e usar um exemplo, siga as instruções fornecidas aqui.
Descrição
Este exemplo mostra ordens de buy limit para entrar a preços melhores durante retrações. As ordens são colocadas abaixo do preço de mercado usando valores do indicador STD, aguardando recuos antes de entrar em posições long. Essa abordagem paciente frequentemente alcança preços de entrada melhores do que ordens de mercado imediatas.
As ordens limit são adequadas para estratégias de range-trading onde o preço oscila entre limites. Ao colocar ordens no limite inferior, os traders entram em níveis ideais dentro do range. A precificação baseada em STD garante que as ordens se adaptem às condições de volatilidade atuais.
A expiração de 75 barras evita que ordens antigas sejam acionadas após as condições de mercado mudarem. Esse limite temporal mantém a relevância da estratégia, garantindo que as ordens reflitam análises de mercado recentes em vez de sinais desatualizados.
Reproduzir o exemplo
Você pode importar este exemplo diretamente ou configurá-lo manualmente. Para replicar manualmente o módulo de trading, certifique-se de que um módulo recém-adicionado inclua as seguintes configurações principais e que o modo profissional esteja ativado:
Trade Basics
- Operation type = Long
Pending Order Settings
- Mode = Limit
- Price calculation method = Indicator value
- Used indicator = STD
- Expiration = 75
Signal Generation - Indicators - STD
- Signal in use = On
- Signal used for = Forward
- Selected indicator = STD
- Draw in chart = Off
- Forward adjustment = 3.50
Signal Generation - Indicators (MACD Main line)
- Signal in use = On
- Signal used for = Entry
- Selected indicator = MACD
- Line index = Main line
- Draw in chart = On
- Drawing slot = 1
Signal Generation - Indicators (MACD Signal line)
- Signal in use = On
- Signal used for = Entry
- Selected indicator = MACD
- Line index = Signal line
- Draw in chart = On
- Drawing slot = 2
Signal Generation - Indicator Combinations (MACD Main line & MACD Signal line)
- Signal in use = On
- Signal used for = Entry
- Input indicator 1 = MACD (Main line)
- Input indicator 2 = MACD (Signal line)
- Value relation = Value 1 cross value 2
Initial Stop Loss
- Selection = Indicator
- Used indicator = STD
Initial Take Profit
- Selection = Risk ratio
- Risk ratio = 1.40
Capturas de tela
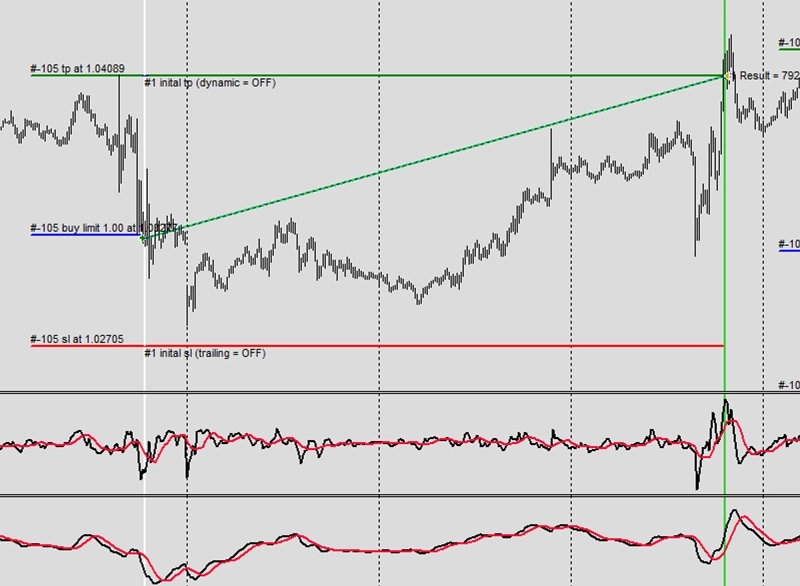
Exemplo G3: Sell stop e preço pendente com StdDev
CAUTION
Esta não é uma estratégia de trading pronta para uso. Uma estratégia de trading requer ajuste do timeframe e do símbolo, além de backtesting rigoroso. O exemplo é destinado como base para sua própria estratégia personalizada e para ajudá-lo a se familiarizar com a aplicação web Expert Advisor Builder. Para importar e usar um exemplo, siga as instruções fornecidas aqui.
Descrição
Este exemplo implementa ordens de sell stop para posições short, colocando ordens abaixo do preço atual para confirmar o momento descendente. O indicador STD determina a distância de colocação ideal, adaptando-se à volatilidade do mercado. Isso garante que as ordens disparem apenas em movimentos descendentes significativos.
As ordens de sell stop protegem contra falsas quebras descendentes em uptrends, exigindo confirmação de preço antes de entrar em posições short. Essa abordagem conservadora reduz shorts prematuros que sofrem perdas imediatas quando os uptrends se retomam. O mecanismo pendente fornece esse filtro de confirmação.
A exibição visual mostra claramente os níveis de ordens pendentes, ajudando os traders a entender onde as ordens aguardam execução. Essa transparência auxilia no aprendizado de como as ordens pendentes interagem com a ação de preço do mercado.
Reproduzir o exemplo
Você pode importar este exemplo diretamente ou configurá-lo manualmente. Para replicar manualmente o módulo de trading, certifique-se de que um módulo recém-adicionado inclua as seguintes configurações principais e que o modo profissional esteja ativado:
Trade Basics
- Operation type = Short
Pending Order Settings
- Mode = Stop
- Price calculation method = Indicator value
- Used indicator = STD
- Expiration = 75
Signal Generation - Indicators - STD
- Signal in use = On
- Signal used for = Forward
- Selected indicator = STD
- Draw in chart = Off
- Forward adjustment = 3.50
Signal Generation - Indicators (MACD Main line)
- Signal in use = On
- Signal used for = Entry
- Selected indicator = MACD
- Line index = Main line
- Draw in chart = On
- Drawing slot = 1
Signal Generation - Indicators (MACD Signal line)
- Signal in use = On
- Signal used for = Entry
- Selected indicator = MACD
- Line index = Signal line
- Draw in chart = On
- Drawing slot = 2
Signal Generation - Indicator Combinations (MACD Main line & MACD Signal line)
- Signal in use = On
- Signal used for = Entry
- Input indicator 1 = MACD (Main line)
- Input indicator 2 = MACD (Signal line)
- Value relation = Value 1 cross value 2
Initial Stop Loss
- Selection = Indicator
- Used indicator = STD
Initial Take Profit
- Selection = Risk ratio
- Risk ratio = 1.40
Capturas de tela
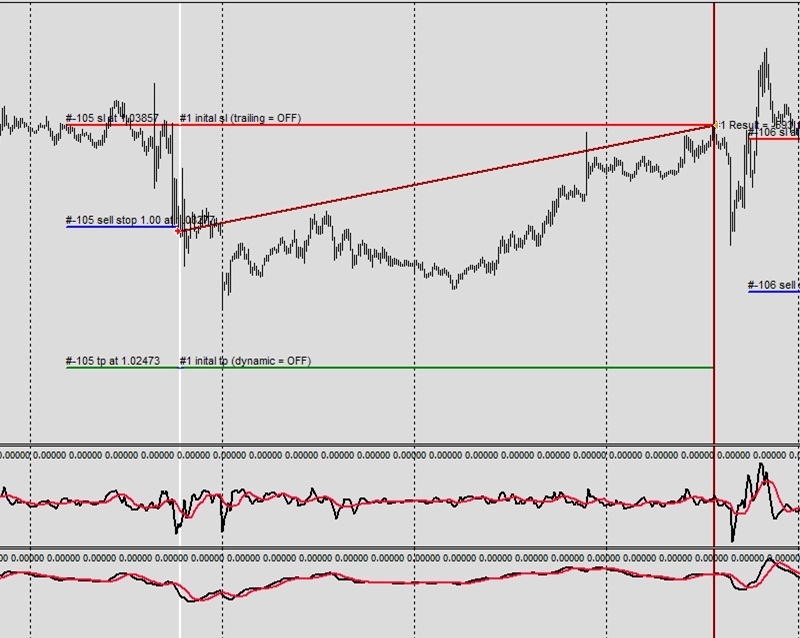
Exemplo G4: Sell limit e preço pendente com StdDev
CAUTION
Esta não é uma estratégia de trading pronta para uso. Uma estratégia de trading requer ajuste do timeframe e do símbolo, além de backtesting rigoroso. O exemplo é destinado como base para sua própria estratégia personalizada e para ajudá-lo a se familiarizar com a aplicação web Expert Advisor Builder. Para importar e usar um exemplo, siga as instruções fornecidas aqui.
Descrição
Este exemplo usa ordens de sell limit para entrar em posições short a preços melhores durante ralis. As ordens são colocadas acima do preço atual, aguardando retrações ascendentes antes de vender. Essa abordagem paciente frequentemente alcança preços de entrada superiores para operações short.
As ordens limit para shorts funcionam bem em downtrends onde os ralis fornecem melhores oportunidades de venda. Ao aguardar esses saltos, os traders entram em níveis de resistência em vez de perseguir o preço para baixo. A precificação baseada em STD garante distância adequada dos níveis atuais de mercado.
A combinação de sinais MACD e execução de ordens limit cria um processo de confirmação em dois passos. Primeiro, o MACD deve sinalizar, depois o preço deve atingir o nível limit, fornecendo dupla verificação antes da entrada na posição.
Reproduzir o exemplo
Você pode importar este exemplo diretamente ou configurá-lo manualmente. Para replicar manualmente o módulo de trading, certifique-se de que um módulo recém-adicionado inclua as seguintes configurações principais e que o modo profissional esteja ativado:
Trade Basics
- Operation type = Short
Pending Order Settings
- Mode = Limit
- Price calculation method = Indicator value
- Used indicator = STD
- Expiration = 75
Signal Generation - Indicators - STD
- Signal in use = On
- Signal used for = Forward
- Selected indicator = STD
- Draw in chart = Off
- Forward adjustment = 3.50
Signal Generation - Indicators (MACD Main line)
- Signal in use = On
- Signal used for = Entry
- Selected indicator = MACD
- Line index = Main line
- Draw in chart = On
- Drawing slot = 1
Signal Generation - Indicators (MACD Signal line)
- Signal in use = On
- Signal used for = Entry
- Selected indicator = MACD
- Line index = Signal line
- Draw in chart = On
- Drawing slot = 2
Signal Generation - Indicator Combinations (MACD Main line & MACD Signal line)
- Signal in use = On
- Signal used for = Entry
- Input indicator 1 = MACD (Main line)
- Input indicator 2 = MACD (Signal line)
- Value relation = Value 1 cross value 2
Initial Stop Loss
- Selection = Indicator
- Used indicator = STD
Initial Take Profit
- Selection = Risk ratio
- Risk ratio = 1.40
Capturas de tela
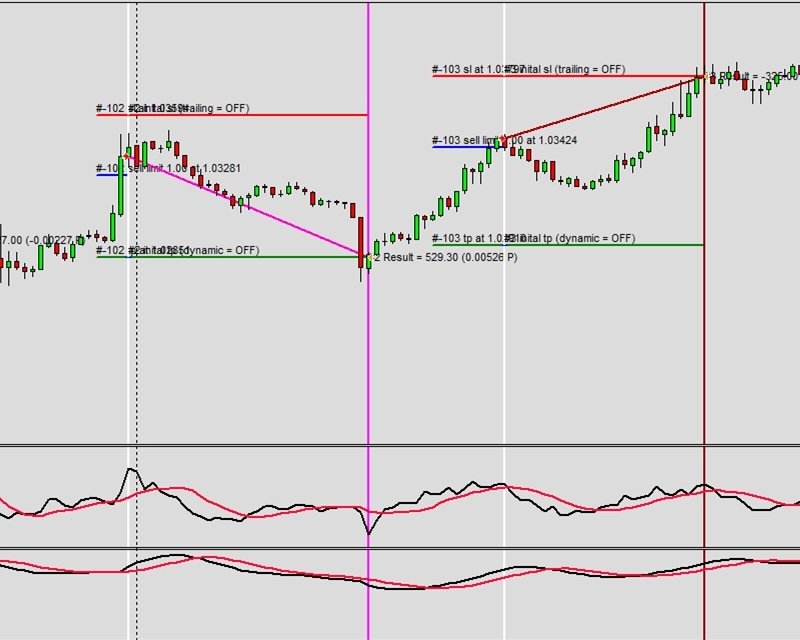
Exemplo G5: Buy stop e preço pendente por taxa de variação
CAUTION
Esta não é uma estratégia de trading pronta para uso. Uma estratégia de trading requer ajuste do timeframe e do símbolo, além de backtesting rigoroso. O exemplo é destinado como base para sua própria estratégia personalizada e para ajudá-lo a se familiarizar com a aplicação web Expert Advisor Builder. Para importar e usar um exemplo, siga as instruções fornecidas aqui.
Descrição
Este exemplo emprega cálculos de taxa de variação para o posicionamento de ordens pendentes. A taxa de variação de 0,00300000 cria preços pendentes baseados em percentual que escalam com o valor do ativo. Essa abordagem relativa mantém comportamento consistente da estratégia à medida que os preços flutuam ao longo do tempo.
Stops fixos de 200 pips podem ser adequados em certos níveis de preço, mas se tornam muito grandes ou pequenos conforme os mercados evoluem. Os cálculos de taxa de variação resolvem isso mantendo relações proporcionais independentemente dos níveis de preço absolutos. Isso cria estratégias mais robustas a longo prazo.
A recomendação de timeframe M1-M15 sugere que essa abordagem é adequada para trading mais rápido onde movimentos rápidos de preço requerem ordens pendentes responsivas. O sistema baseado em percentual se adapta automaticamente a diferentes regimes de volatilidade.
CAUTION
Recomendado usar M1 - M15
Reproduzir o exemplo
Você pode importar este exemplo diretamente ou configurá-lo manualmente. Para replicar manualmente o módulo de trading, certifique-se de que um módulo recém-adicionado inclua as seguintes configurações principais e que o modo profissional esteja ativado:
Trade Basics
- Operation type = Long
Pending Order Settings
- Mode = Stop
- Price calculation method = Rate of change
- Rate of change = 0.00300000
- Expiration = 75
Signal Generation - Indicators (MACD Main line)
- Signal in use = On
- Signal used for = Entry
- Selected indicator = MACD
- Line index = Main line
- Draw in chart = On
- Drawing slot = 1
Signal Generation - Indicators (MACD Signal line)
- Signal in use = On
- Signal used for = Entry
- Selected indicator = MACD
- Line index = Signal line
- Draw in chart = On
- Drawing slot = 2
Signal Generation - Indicator Combinations (MACD Main line & MACD Signal line)
- Signal in use = On
- Signal used for = Entry
- Input indicator 1 = MACD (Main line)
- Input indicator 2 = MACD (Signal line)
- Value relation = Value 1 cross value 2
Initial Stop Loss
- Selection = Rate of change
- Rate change = 0.00250000
Initial Take Profit
- Selection = Risk ratio
- Risk ratio = 1.40
Capturas de tela
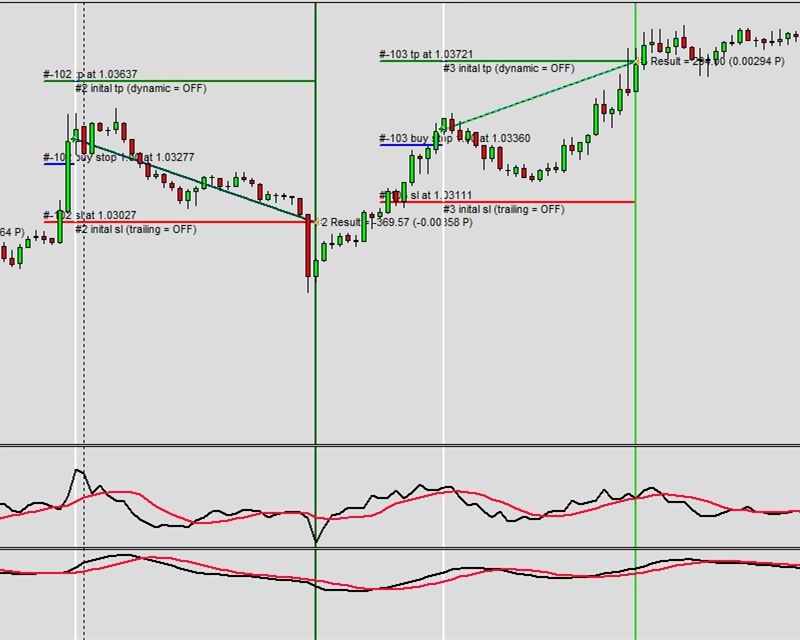
Exemplo G6: Buy stop e valor de indicador para preço pendente
CAUTION
Esta não é uma estratégia de trading pronta para uso. Uma estratégia de trading requer ajuste do timeframe e do símbolo, além de backtesting rigoroso. O exemplo é destinado como base para sua própria estratégia personalizada e para ajudá-lo a se familiarizar com a aplicação web Expert Advisor Builder. Para importar e usar um exemplo, siga as instruções fornecidas aqui.
Descrição
Este exemplo usa os valores superiores das Bollinger Bands para o posicionamento de ordens stop. Quando ocorrem sinais MACD, as ordens pendentes são colocadas no nível da banda superior, exigindo que o preço rompa acima desse limite estatístico antes de entrar. Isso combina confirmação de momento com níveis baseados em volatilidade.
As Bollinger Bands fornecem níveis de resistência dinâmicos que se expandem e se contraem com a volatilidade. Usar esses para ordens pendentes garante que as entradas ocorram apenas quando o preço rompe níveis significativos, não apenas resistência menor. Essa filtragem reduz falsos breakouts em mercados de range.
O preço pendente baseado em indicador elimina a seleção subjetiva de níveis, criando pontos de entrada consistentes e matematicamente derivados. Essa objetividade remove a tomada de decisão emocional do timing de entrada de operações.
Reproduzir o exemplo
Você pode importar este exemplo diretamente ou configurá-lo manualmente. Para replicar manualmente o módulo de trading, certifique-se de que um módulo recém-adicionado inclua as seguintes configurações principais e que o modo profissional esteja ativado:
Trade Basics
- Operation type = Long
Pending Order Settings
- Mode = Stop
- Price calculation method = Indicator value
- Used indicator = BB
- Expiration = 75
Signal Generation - Indicators - STD
- Signal in use = On
- Signal used for = Forward
- Selected indicator = STD
- Draw in chart = Off
- Forward adjustment = 3.50
Signal Generation - Indicators (MACD Main line)
- Signal in use = On
- Signal used for = Entry
- Selected indicator = MACD
- Line index = Main line
- Draw in chart = On
- Drawing slot = 1
Signal Generation - Indicators (MACD Signal line)
- Signal in use = On
- Signal used for = Entry
- Selected indicator = MACD
- Line index = Signal line
- Draw in chart = On
- Drawing slot = 2
Signal Generation - Indicators (BB Upper)
- Signal in use = On
- Signal used for = Forward
- Selected indicator = BB
- Line index = Upper
- Draw in chart = On
- Drawing slot = 3
Signal Generation - Indicator Combinations (MACD Main line & MACD Signal line)
- Signal in use = On
- Signal used for = Entry
- Input indicator 1 = MACD (Main line)
- Input indicator 2 = MACD (Signal line)
- Value relation = Value 2 cross value 1
Initial Stop Loss
- Selection = Indicator
- Used indicator = STD
Initial Take Profit
- Selection = Risk ratio
- Risk ratio = 1.40
Capturas de tela
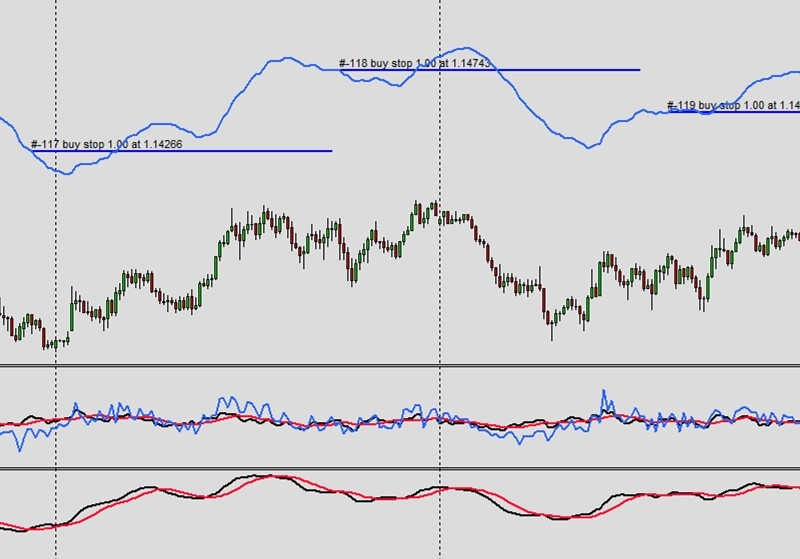
Exemplo G7: Buy stop e suporte e resistência para preço pendente
CAUTION
Esta não é uma estratégia de trading pronta para uso. Uma estratégia de trading requer ajuste do timeframe e do símbolo, além de backtesting rigoroso. O exemplo é destinado como base para sua própria estratégia personalizada e para ajudá-lo a se familiarizar com a aplicação web Expert Advisor Builder. Para importar e usar um exemplo, siga as instruções fornecidas aqui.
Descrição
Este exemplo utiliza o suporte e a resistência do analisador de gráficos para o posicionamento de ordens pendentes. O analisador identifica níveis-chave automaticamente, colocando ordens pendentes nesses pontos de preço psicológicos. Isso alinha as entradas com níveis onde atividade de trading significativa normalmente ocorre.
Os níveis de suporte e resistência frequentemente agem como ímãs para o preço, atraindo fluxo de ordens de muitos participantes do mercado. Colocar ordens pendentes nesses níveis aumenta a probabilidade de preenchimento enquanto garante a entrada em pontos de preço significativos. A expiração de 75 barras evita que níveis desatualizados acionem operações.
A exibição visual de suporte e resistência ajuda os traders a entender o processo de decisão do analisador de gráficos. Essa transparência gera confiança nas decisões automatizadas de seleção de níveis enquanto educa os traders sobre os princípios de estrutura de mercado.
Reproduzir o exemplo
Você pode importar este exemplo diretamente ou configurá-lo manualmente. Para replicar manualmente o módulo de trading, certifique-se de que um módulo recém-adicionado inclua as seguintes configurações principais e que o modo profissional esteja ativado:
Trade Basics
- Operation type = Long
Pending Order Settings
- Mode = Stop
- Price calculation method = Support/resistance from chart analyzer
- Used chart analyzer = Chart Analyzer
- Expiration = 75
Signal Generation - Indicators - STD
- Signal in use = On
- Signal used for = Forward
- Selected indicator = STD
- Draw in chart = Off
- Forward adjustment = 3.50
Signal Generation - Indicators (MACD Main line)
- Signal in use = On
- Signal used for = Entry
- Selected indicator = MACD
- Line index = Main line
- Draw in chart = On
- Drawing slot = 1
Signal Generation - Indicators (MACD Signal line)
- Signal in use = On
- Signal used for = Entry
- Selected indicator = MACD
- Line index = Signal line
- Draw in chart = On
- Drawing slot = 2
Signal Generation - Indicator Combinations (MACD Main line & MACD Signal line)
- Signal in use = On
- Signal used for = Entry
- Input indicator 1 = MACD (Main line)
- Input indicator 2 = MACD (Signal line)
- Value relation = Value 2 cross value 1
Signal Generation - Chart Analyzer
- Signal in use = On
- Signal used for = Forward
- Draw boundaries = Off
- Draw extrema = Off
- Draw supports and resistances = On
- Draw swing phase = Off
- Supports and resistances forward = ALL
- Support multiplier = 1.00
- Resistance multiplier = 1.00
Initial Stop Loss
- Selection = Indicator
- Used indicator = STD
Initial Take Profit
- Selection = Risk ratio
- Risk ratio = 1.40
Capturas de tela
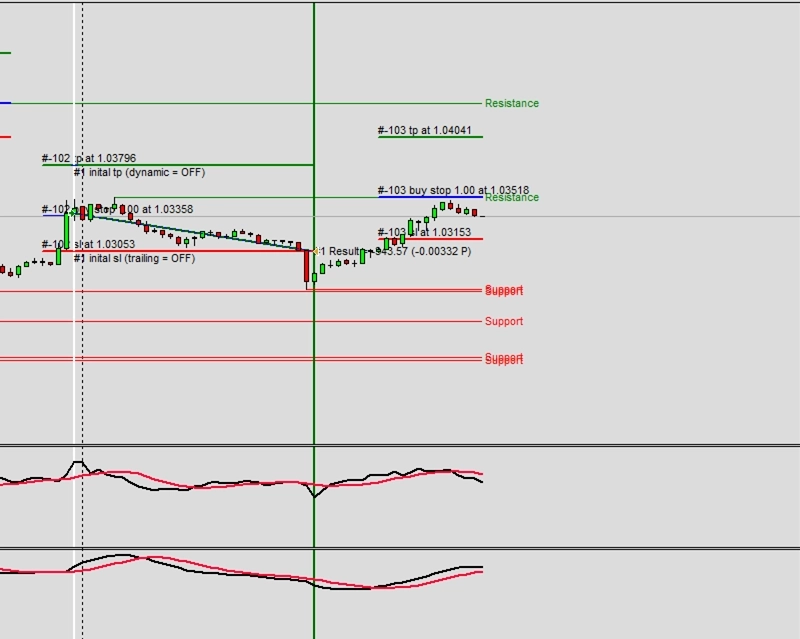
Exemplo G8: Buy stop e ativação dependente de preço (histerese mín)
CAUTION
Esta não é uma estratégia de trading pronta para uso. Uma estratégia de trading requer ajuste do timeframe e do símbolo, além de backtesting rigoroso. O exemplo é destinado como base para sua própria estratégia personalizada e para ajudá-lo a se familiarizar com a aplicação web Expert Advisor Builder. Para importar e usar um exemplo, siga as instruções fornecidas aqui.
Descrição
Este exemplo apresenta a histerese para ordens pendentes gerenciadas localmente. A histerese mínima de -50% requer que o preço se mova além do nível pendente antes de disparar, evitando ativação por toques breves. Isso filtra falsos breakouts que imediatamente revertem.
O gerenciamento local mantém as ordens pendentes invisíveis para os corretores, evitando a caça de stops ou front-running. O recurso de histerese adiciona outra camada de proteção, garantindo movimento de preço significativo antes da ativação. Essa dupla proteção reduz significativamente as entradas falsas.
O preço pendente baseado em ATR combina com a histerese para criar condições de entrada adaptativas. À medida que a volatilidade muda, tanto o nível pendente quanto o requisito de histerese se ajustam proporcionalmente, mantendo comportamento consistente da estratégia.
Reproduzir o exemplo
Você pode importar este exemplo diretamente ou configurá-lo manualmente. Para replicar manualmente o módulo de trading, certifique-se de que um módulo recém-adicionado inclua as seguintes configurações principais e que o modo profissional esteja ativado:
Trade Basics
- Operation type = Long
Pending Order Settings
- Mode = Stop
- Price calculation method = Indicator value
- Used indicator = ATR
- Expiration = 75
- Locally managed limit and stop orders = On
- Hysteresis minimum value = -50
Signal Generation - Indicators - STD
- Signal in use = On
- Signal used for = Forward
- Selected indicator = STD
- Draw in chart = Off
- Forward adjustment = 3.50
Signal Generation - Indicators (MACD Main line)
- Signal in use = On
- Signal used for = Entry
- Selected indicator = MACD
- Line index = Main line
- Draw in chart = On
- Drawing slot = 1
Signal Generation - Indicators (MACD Signal line)
- Signal in use = On
- Signal used for = Entry
- Selected indicator = MACD
- Line index = Signal line
- Draw in chart = On
- Drawing slot = 2
Signal Generation - Indicators (ATR)
- Signal in use = On
- Signal used for = Forward
- Selected indicator = ATR
- Draw in chart = Off
- Forward adjustment = 3.50
Signal Generation - Indicator Combinations (MACD Main line & MACD Signal line)
- Signal in use = On
- Signal used for = Entry
- Input indicator 1 = MACD (Main line)
- Input indicator 2 = MACD (Signal line)
- Value relation = Value 2 cross value 1
Initial Stop Loss
- Selection = Indicator
- Used indicator = STD
Initial Take Profit
- Selection = Risk ratio
- Risk ratio = 1.40
Capturas de tela
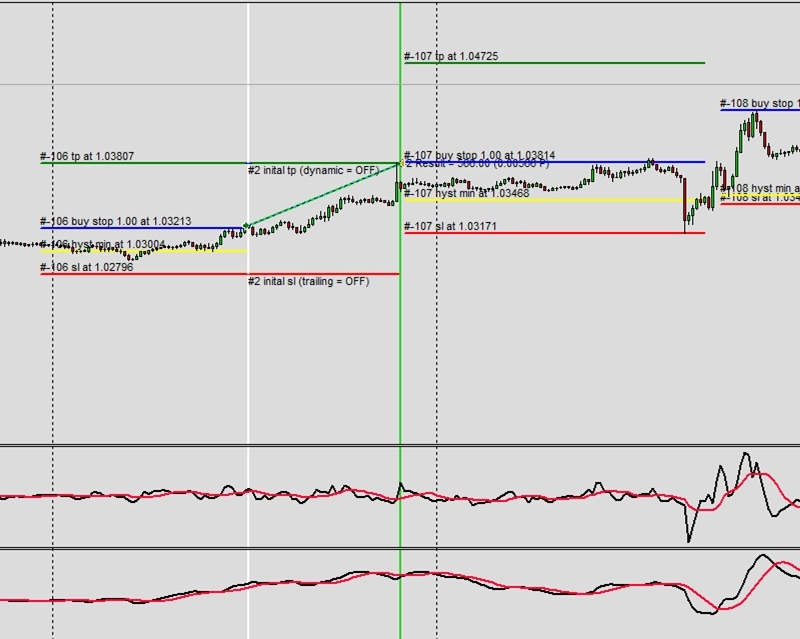
Exemplo G9: Buy stop e cancelamento dependente de preço (histerese máx)
CAUTION
Esta não é uma estratégia de trading pronta para uso. Uma estratégia de trading requer ajuste do timeframe e do símbolo, além de backtesting rigoroso. O exemplo é destinado como base para sua própria estratégia personalizada e para ajudá-lo a se familiarizar com a aplicação web Expert Advisor Builder. Para importar e usar um exemplo, siga as instruções fornecidas aqui.
Descrição
Este exemplo demonstra a histerese máxima para cancelamento automático de ordens. Se o preço se mover 50 pips além do nível pendente sem disparar, a ordem cancela automaticamente. Isso evita entradas tardias após a oportunidade ter passado, mantendo a integridade de temporização da estratégia.
A histerese máxima age como uma ordem stop-limit, definindo tanto o preço de disparo quanto o preço máximo de entrada aceitável. Isso evita o slippage durante mercados rápidos enquanto garante que as entradas ocorram dentro de intervalos aceitáveis. O cancelamento automático remove ordens desatualizadas que não refletem mais as condições atuais.
Combinado com o gerenciamento local, isso cria comportamento sofisticado de ordens pendentes impossível com ordens padrão de corretores. A flexibilidade permite controle preciso de entrada adaptado aos requisitos específicos da estratégia.
Reproduzir o exemplo
Você pode importar este exemplo diretamente ou configurá-lo manualmente. Para replicar manualmente o módulo de trading, certifique-se de que um módulo recém-adicionado inclua as seguintes configurações principais e que o modo profissional esteja ativado:
Trade Basics
- Operation type = Long
Pending Order Settings
- Mode = Stop
- Price calculation method = Indicator value
- Used indicator = ATR
- Expiration = 75
- Locally managed limit and stop orders = On
- Hysteresis maximum value = -50
Signal Generation - Indicators - STD
- Signal in use = On
- Signal used for = Forward
- Selected indicator = STD
- Draw in chart = Off
- Forward adjustment = 3.50
Signal Generation - Indicators (MACD Main line)
- Signal in use = On
- Signal used for = Entry
- Selected indicator = MACD
- Line index = Main line
- Draw in chart = On
- Drawing slot = 1
Signal Generation - Indicators (MACD Signal line)
- Signal in use = On
- Signal used for = Entry
- Selected indicator = MACD
- Line index = Signal line
- Draw in chart = On
- Drawing slot = 2
Signal Generation - Indicators (ATR)
- Signal in use = On
- Signal used for = Forward
- Selected indicator = ATR
- Draw in chart = Off
- Forward adjustment = 3.50
Signal Generation - Indicator Combinations (MACD Main line & MACD Signal line)
- Signal in use = On
- Signal used for = Entry
- Input indicator 1 = MACD (Main line)
- Input indicator 2 = MACD (Signal line)
- Value relation = Value 2 cross value 1
Initial Stop Loss
- Selection = Indicator
- Used indicator = STD
Initial Take Profit
- Selection = Risk ratio
- Risk ratio = 1.40
Capturas de tela
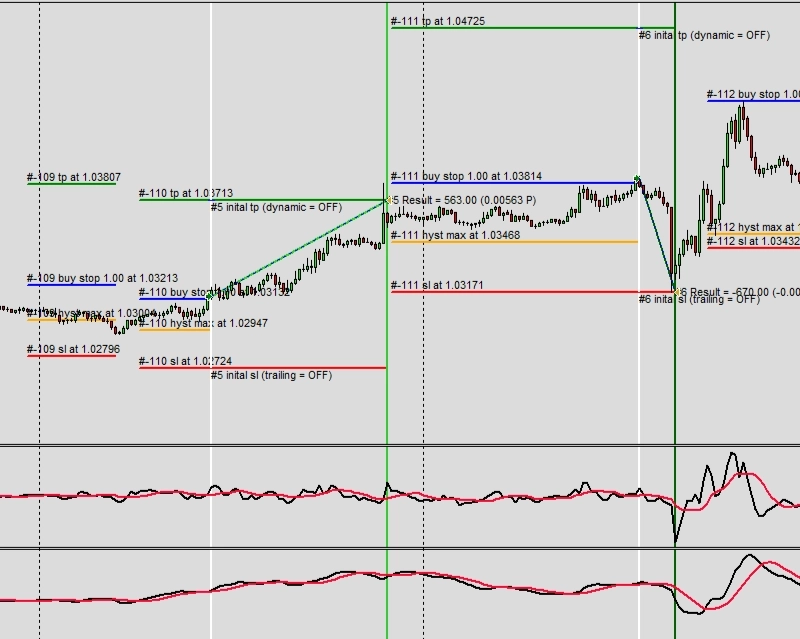
Exemplo H1: Eventos filtrados por título
CAUTION
Esta não é uma estratégia de trading pronta para uso. Uma estratégia de trading requer ajuste do timeframe e do símbolo, além de backtesting rigoroso. O exemplo é destinado como base para sua própria estratégia personalizada e para ajudá-lo a se familiarizar com a aplicação web Expert Advisor Builder. Para importar e usar um exemplo, siga as instruções fornecidas aqui.
Descrição
Este exemplo filtra eventos de notícias pelo conteúdo do título, focando apenas nos anúncios do BCE e do Fed. O filtro exclusivo garante que apenas eventos contendo esses termos específicos gerem sinais. Essa abordagem direcionada elimina ruído de notícias de menor impacto enquanto se concentra nas principais decisões dos bancos centrais.
A tabela de eventos visuais e as linhas do gráfico exibem claramente os eventos filtrados, mostrando exatamente quais anúncios acionarão sinais. As janelas de 30 minutos antes e depois fornecem tempo adequado para posicionamento em torno desses grandes eventos. A filtragem por título permite a seleção precisa de eventos sem monitorar todas as notícias.
Os eventos dos bancos centrais frequentemente criam os maiores movimentos de mercado, tornando-os ideais para estratégias de news trading. Ao filtrar especificamente para esses eventos, os traders podem se preparar minuciosamente para cada oportunidade em vez de reagir a numerosos anúncios menores.
Reproduzir o exemplo
Você pode importar este exemplo diretamente ou configurá-lo manualmente. Para replicar manualmente o módulo de trading, certifique-se de que um módulo recém-adicionado inclua as seguintes configurações principais e que o modo profissional esteja ativado:
Trade Basics
- Operation type = Long signals only drawn
- General signal visualization = Off
Signal Generation - News
- Signal in use = On
- Signal used for = Entry
- Draw table with upcoming events = On
- Draw signal lines with name in chart = On
- Pre event signal time = 1800
- Post event signal time = 1800
- Signals for ALL regions = On
- Signals for AUD region = On
- Signals for BRL region = On
- Signals for CAD region = On
- Signals for CHF region = On
- Signals for CNY region = On
- Signals for EUR region = On
- Signals for GBP region = On
- Signals for HKD region = On
- Signals for INR region = On
- Signals for JPY region = On
- Signals for KRW region = On
- Signals for MXN region = On
- Signals for NOK region = On
- Signals for NZD region = On
- Signals for SEK region = On
- Signals for SGD region = On
- Signals for USD region = On
- Signals for ZAR region = On
Signal Generation - News - Title filter 1
- Filter type = Exclusive
- Title name to filter = ECB
Signal Generation - News - Title filter 2
- Filter type = Exclusive
- Title name to filter = Fed
Capturas de tela
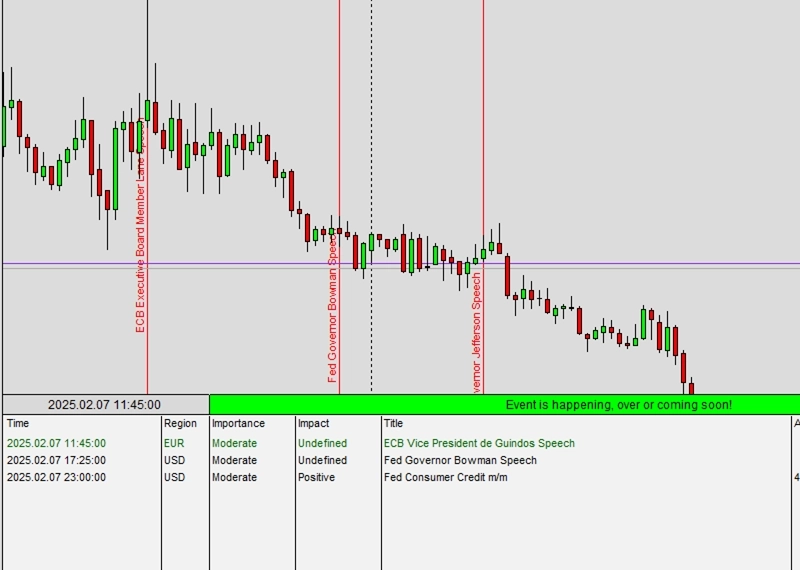
Exemplo H2: Eventos filtrados por relação
CAUTION
Esta não é uma estratégia de trading pronta para uso. Uma estratégia de trading requer ajuste do timeframe e do símbolo, além de backtesting rigoroso. O exemplo é destinado como base para sua própria estratégia personalizada e para ajudá-lo a se familiarizar com a aplicação web Expert Advisor Builder. Para importar e usar um exemplo, siga as instruções fornecidas aqui.
Descrição
Este exemplo filtra eventos pelas relações entre os valores reais e anteriores. Apenas eventos onde os resultados reais superam os valores anteriores geram sinais, visando surpresas positivas que frequentemente impulsionam os preços para cima. Essa filtragem por relação não requer conhecer valores absolutos, apenas melhorias relativas.
A exibição visual mostra quais eventos atendem aos critérios de relação, proporcionando transparência na geração de sinais. As relações de valor provam ser mais confiáveis do que limites absolutos, pois os indicadores econômicos variam amplamente em escala e significância. Essa abordagem relativa se adapta a diferentes tipos de anúncios.
Focar em melhorias filtra resultados decepcionantes que podem desencadear vendas. Esse viés direcional alinha os sinais com as prováveis reações do mercado, melhorando a qualidade dos sinais sem análise fundamental complexa.
Reproduzir o exemplo
Você pode importar este exemplo diretamente ou configurá-lo manualmente. Para replicar manualmente o módulo de trading, certifique-se de que um módulo recém-adicionado inclua as seguintes configurações principais e que o modo profissional esteja ativado:
Trade Basics
- Operation type = Long signals only drawn
- General signal visualization = Off
Signal Generation - News
- Signal in use = On
- Signal used for = Entry
- Draw table with upcoming events = On
- Draw signal lines with name in chart = On
- Pre event signal time = 1800
- Post event signal time = 1800
- Signals for ALL regions = On
- Signals for AUD region = On
- Signals for BRL region = On
- Signals for CAD region = On
- Signals for CHF region = On
- Signals for CNY region = On
- Signals for EUR region = On
- Signals for GBP region = On
- Signals for HKD region = On
- Signals for INR region = On
- Signals for JPY region = On
- Signals for KRW region = On
- Signals for MXN region = On
- Signals for NOK region = On
- Signals for NZD region = On
- Signals for SEK region = On
- Signals for SGD region = On
- Signals for USD region = On
- Signals for ZAR region = On
Value relation 1
- Relation condition = Actual greater previous
Capturas de tela
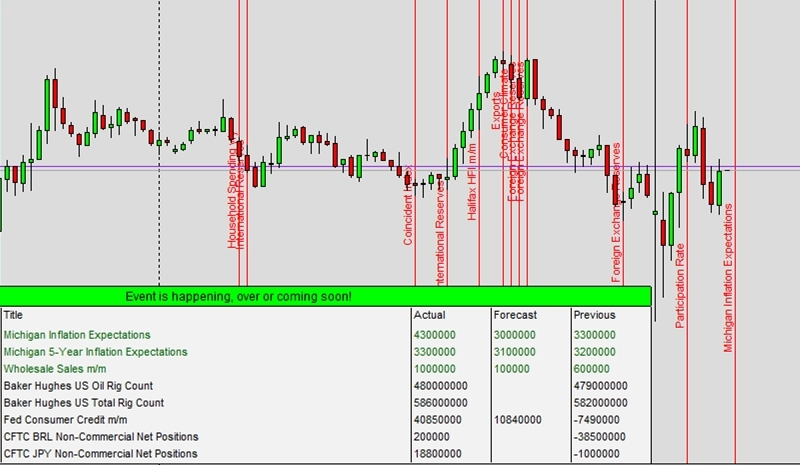
Exemplo I1: Uma linha de indicador utilizada
CAUTION
Esta não é uma estratégia de trading pronta para uso. Uma estratégia de trading requer ajuste do timeframe e do símbolo, além de backtesting rigoroso. O exemplo é destinado como base para sua própria estratégia personalizada e para ajudá-lo a se familiarizar com a aplicação web Expert Advisor Builder. Para importar e usar um exemplo, siga as instruções fornecidas aqui.
Descrição
Este exemplo demonstra condições de gradiente básico de indicador para geração de sinais. O indicador SMA gera sinais quando sua inclinação cruza acima de zero, indicando que a média móvel começou a subir. Essa condição simples identifica potenciais inícios de tendência com complexidade mínima.
A abordagem de cruzamento de gradiente difere dos métodos de cruzamento de preço ao focar nas mudanças de direção do indicador em vez de posições absolutas. Isso frequentemente fornece sinais mais cedo à medida que os indicadores começam a virar antes que o preço os cruze. As linhas de sinal visuais marcam claramente quando as condições de gradiente são atendidas.
Estratégias de indicador único provam ser valiosas para entender conceitos fundamentais antes de adicionar complexidade. Este exemplo ensina como as inclinações de indicadores geram sinais, formando a base para abordagens mais sofisticadas de múltiplos indicadores.
Reproduzir o exemplo
Você pode importar este exemplo diretamente ou configurá-lo manualmente. Para replicar manualmente o módulo de trading, certifique-se de que um módulo recém-adicionado inclua as seguintes configurações principais e que o modo profissional esteja ativado:
Trade Basics
- Operation type = Long signals only drawn
- General signal visualization = On
Signal Generation - Indicators - SMA
- Signal in use = On
- Signal used for = Entry
- Selected indicator = SMA
- Gradient condition = Cross Limit 1
- Gradient limit 1 = 0.00000000
- Draw in chart = On
- Drawing slot = 1
Capturas de tela
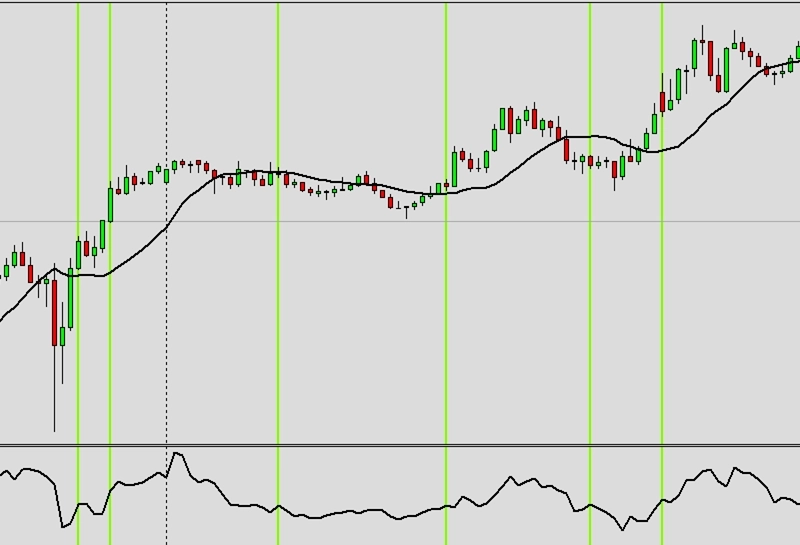
Exemplo I2: Uma linha de indicador com exclusão de tempo utilizada
CAUTION
Esta não é uma estratégia de trading pronta para uso. Uma estratégia de trading requer ajuste do timeframe e do símbolo, além de backtesting rigoroso. O exemplo é destinado como base para sua própria estratégia personalizada e para ajudá-lo a se familiarizar com a aplicação web Expert Advisor Builder. Para importar e usar um exemplo, siga as instruções fornecidas aqui.
Descrição
Este exemplo adiciona exclusão de tempo aos sinais de indicador, bloqueando sinais durante horários específicos. A exclusão de 22h a 9h remove os períodos noturnos e de manhã cedo quando os spreads podem ser maiores e a liquidez menor. Essa filtragem temporal melhora a qualidade dos sinais ao focar nos horários de trading ideais.
A exclusão de tempo difere do componente de temporização ao desabilitar completamente o processamento de sinais durante os períodos excluídos. Mesmo que condições de indicador perfeitas ocorram, nenhum sinal é gerado. Esse filtro rígido garante que as estratégias operem apenas durante as sessões de mercado pretendidas.
A combinação de indicadores técnicos e filtragem temporal cria estratégias mais robustas. Ao eliminar períodos desfavoráveis, os sinais restantes têm maior probabilidade de sucesso devido a melhores condições de mercado.
Reproduzir o exemplo
Você pode importar este exemplo diretamente ou configurá-lo manualmente. Para replicar manualmente o módulo de trading, certifique-se de que um módulo recém-adicionado inclua as seguintes configurações principais e que o modo profissional esteja ativado:
Trade Basics
- Operation type = Long signals only drawn
- General signal visualization = On
Signal Generation - Indicators - SMA
- Signal in use = On
- Signal used for = Entry
- Selected indicator = SMA
- Gradient condition = Cross Limit 1
- Gradient limit 1 = 0.00000000
- Draw in chart = On
- Drawing slot = 1
- Exclusion time range = 22:00:00-09:00:00
Capturas de tela
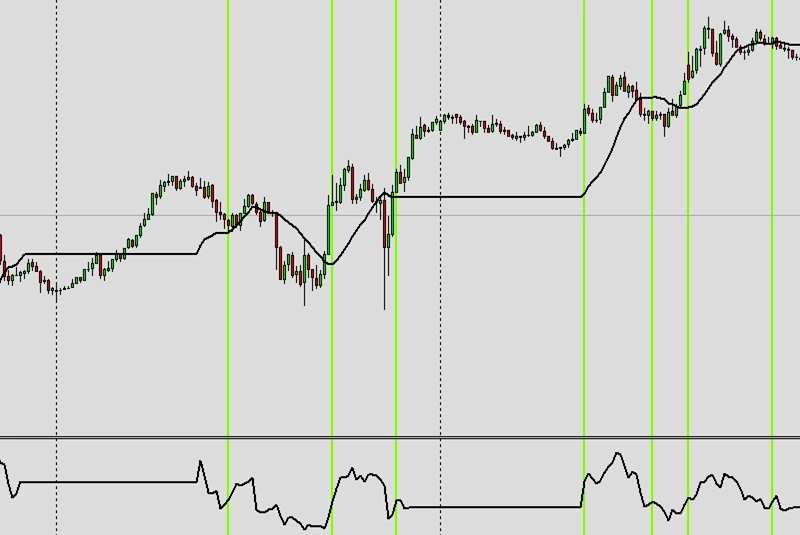
Exemplo I3: Duas linhas de indicador combinadas
CAUTION
Esta não é uma estratégia de trading pronta para uso. Uma estratégia de trading requer ajuste do timeframe e do símbolo, além de backtesting rigoroso. O exemplo é destinado como base para sua própria estratégia personalizada e para ajudá-lo a se familiarizar com a aplicação web Expert Advisor Builder. Para importar e usar um exemplo, siga as instruções fornecidas aqui.
Descrição
Este exemplo combina duas médias móveis para geração de sinais usando seus pontos de cruzamento. Quando a SMA mais rápida cruza acima da EMA mais lenta, ocorrem sinais de compra. Essa abordagem clássica de análise técnica tem sido usada por traders por décadas devido à sua simplicidade e eficácia.
Os cruzamentos de médias móveis suavizam a ação de preço enquanto identificam mudanças de tendência. A abordagem de duas linhas fornece confirmação à medida que ambas as médias devem se alinhar para os sinais. A exibição visual de ambas as linhas ajuda os traders a entender a dinâmica de relação que impulsiona a geração de sinais.
Essa estratégia fundamental ensina os princípios de combinação de indicadores aplicáveis a qualquer par de indicadores. Entender como dois indicadores interagem prepara os traders para sistemas mais complexos de múltiplos indicadores.
Reproduzir o exemplo
Você pode importar este exemplo diretamente ou configurá-lo manualmente. Para replicar manualmente o módulo de trading, certifique-se de que um módulo recém-adicionado inclua as seguintes configurações principais e que o modo profissional esteja ativado:
Trade Basics
- Operation type = Long signals only drawn
- General signal visualization = On
Signal Generation - Indicators - SMA
- Signal in use = On
- Signal used for = Entry
- Selected indicator = SMA
- Draw in chart = On
- Drawing slot = 1
Signal Generation - Indicators - EMA
- Signal in use = On
- Signal used for = Entry
- Selected indicator = EMA
- Draw in chart = On
- Drawing slot = 2
Signal Generation - Indicator Combinations (SMA & EMA)
- Signal in use = On
- Signal used for = Entry
- Input indicator 1 = SMA
- Input indicator 2 = EMA
- Value relation = Value x cross value x
Capturas de tela
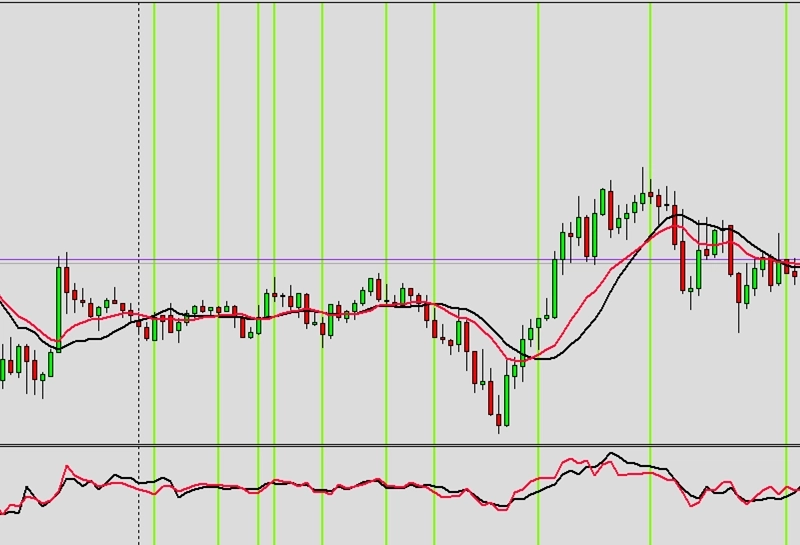
Exemplo I4: Quatro linhas de indicador combinadas
CAUTION
Esta não é uma estratégia de trading pronta para uso. Uma estratégia de trading requer ajuste do timeframe e do símbolo, além de backtesting rigoroso. O exemplo é destinado como base para sua própria estratégia personalizada e para ajudá-lo a se familiarizar com a aplicação web Expert Advisor Builder. Para importar e usar um exemplo, siga as instruções fornecidas aqui.
Descrição
Este exemplo emprega quatro médias móveis diferentes com várias condições para criar um filtro de sinal abrangente. Cada média deve atender a requisitos específicos de gradiente para sinais positivos. A SMA e a EMA usam condições de cruzamento, enquanto a LWMA e a SMMA requerem inclinações positivas.
A confirmação de múltiplos indicadores reduz drasticamente os sinais falsos ao exigir acordo de diferentes métodos de cálculo. Cada tipo de média móvel responde de forma diferente às mudanças de preço, portanto o acordo unânime indica fortes condições de tendência. A SMMA de 100 períodos fornece confirmação de tendência de longo prazo.
Esse sistema de filtragem complexo demonstra como múltiplos indicadores podem trabalhar juntos sem criar sinais contraditórios. A abordagem graduada de médias rápidas a lentas garante o alinhamento tanto do momentum de curto prazo quanto da tendência de longo prazo.
Reproduzir o exemplo
Você pode importar este exemplo diretamente ou configurá-lo manualmente. Para replicar manualmente o módulo de trading, certifique-se de que um módulo recém-adicionado inclua as seguintes configurações principais e que o modo profissional esteja ativado:
Trade Basics
- Operation type = Long signals only drawn
- General signal visualization = On
Signal Generation - Indicators - SMA
- Signal in use = On
- Signal used for = Entry
- Selected indicator = SMA
- Draw in chart = On
- Drawing slot = 1
Signal Generation - Indicators - EMA
- Signal in use = On
- Signal used for = Entry
- Selected indicator = EMA
- Draw in chart = On
- Drawing slot = 2
Signal Generation - Indicators - EMA
- Signal in use = On
- Signal used for = Entry
- Selected indicator = LWMA
- Gradient condition = Greater Limit 1
- Gradient limit 1 = 0.00000000
- Draw in chart = On
- Drawing slot = 3
Signal Generation - Indicators - SMMA
- Signal in use = On
- Signal used for = Entry
- Selected indicator = SMMA
- Period = 100
- Gradient condition = Greater Limit 1
- Gradient limit 1 = 0.00000000
- Draw in chart = On
- Drawing slot = 4
Signal Generation - Indicator Combinations (SMA & EMA)
- Signal in use = On
- Signal used for = Entry
- Input indicator 1 = SMA
- Input indicator 2 = EMA
- Value relation = Value x cross value x
Capturas de tela
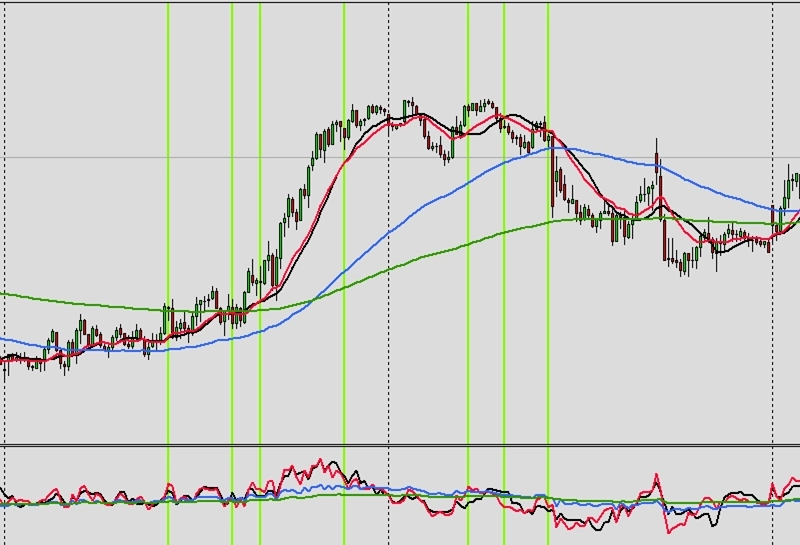
Exemplo I5: Usando preço como indicador
CAUTION
Esta não é uma estratégia de trading pronta para uso. Uma estratégia de trading requer ajuste do timeframe e do símbolo, além de backtesting rigoroso. O exemplo é destinado como base para sua própria estratégia personalizada e para ajudá-lo a se familiarizar com a aplicação web Expert Advisor Builder. Para importar e usar um exemplo, siga as instruções fornecidas aqui.
Descrição
Este exemplo usa o preço em si como indicador, especificamente o preço de abertura de cada barra. Essa abordagem direta elimina o lag do indicador, fornecendo resposta imediata às mudanças de preço. O indicador PRICE permite que qualquer componente de preço (abertura, máxima, mínima, fechamento) gere sinais.
Usar dados de preço bruto é adequado para estratégias de breakout onde níveis de preço específicos importam mais do que indicadores suavizados. A exibição visual mostra exatamente quais pontos de preço geram sinais, proporcionando transparência completa. Essa abordagem ensina a diferença entre geração de sinais baseada em preço e baseada em indicador.
As estratégias de preço como indicador frequentemente se combinam com outros filtros para evitar sinais excessivos. Embora responsivos, os preços brutos podem ser barulhentos, tornando a confirmação adicional valiosa para filtrar movimentos falsos.
Reproduzir o exemplo
Você pode importar este exemplo diretamente ou configurá-lo manualmente. Para replicar manualmente o módulo de trading, certifique-se de que um módulo recém-adicionado inclua as seguintes configurações principais e que o modo profissional esteja ativado:
Trade Basics
- Operation type = Long signals only drawn
- General signal visualization = On
Signal Generation - Indicators - PRICE
- Signal in use = On
- Signal used for = Entry
- Selected indicator = PRICE
- Series = Open
- Draw in chart = On
- Drawing slot = 1
Capturas de tela
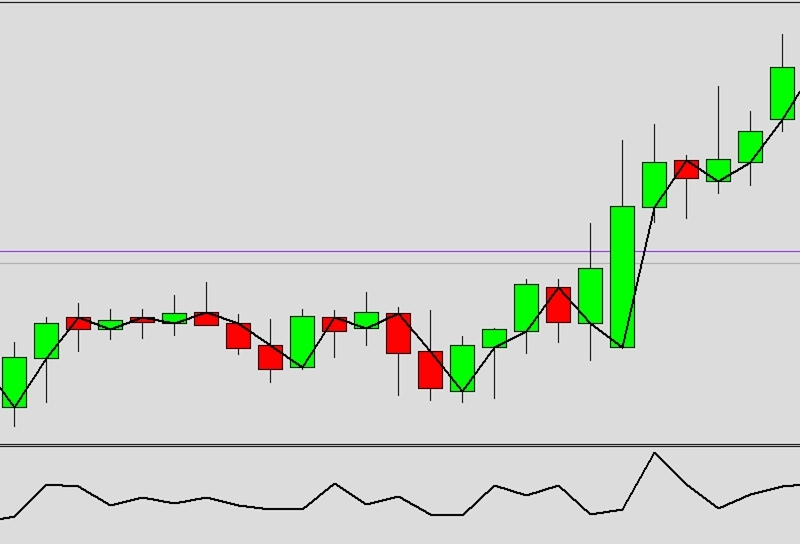
Exemplo J1: Uma linha de oscilador usada como sinal
CAUTION
Esta não é uma estratégia de trading pronta para uso. Uma estratégia de trading requer ajuste do timeframe e do símbolo, além de backtesting rigoroso. O exemplo é destinado como base para sua própria estratégia personalizada e para ajudá-lo a se familiarizar com a aplicação web Expert Advisor Builder. Para importar e usar um exemplo, siga as instruções fornecidas aqui.
Descrição
Este exemplo gera sinais a partir de valores do oscilador RSI cruzando o nível 70, identificando condições de sobrecompra. Ao contrário dos indicadores de tendência que seguem o preço, os osciladores medem o momentum e os extremos, fornecendo diferentes tipos de sinais. A exibição visual mostra os valores do RSI e os pontos de cruzamento claramente.
Os sinais de oscilador frequentemente contradizem os sinais de tendência, identificando potenciais reversões em vez de continuações. O nível 70 representa condições estatisticamente de sobrecompra onde o momentum ascendente pode se esgotar. Essa abordagem contrária é adequada para estratégias de range-trading onde os extremos revertem.
Estratégias de oscilador único ensinam conceitos de momentum essenciais para entender a dinâmica do mercado. O intervalo limitado de 0 a 100 do RSI torna a interpretação direta, ideal para aprender trading baseado em oscilador.
Reproduzir o exemplo
Você pode importar este exemplo diretamente ou configurá-lo manualmente. Para replicar manualmente o módulo de trading, certifique-se de que um módulo recém-adicionado inclua as seguintes configurações principais e que o modo profissional esteja ativado:
Trade Basics
- Operation type = Long signals only drawn
- General signal visualization = On
Signal Generation - Indicators - RSI
- Signal in use = On
- Signal used for = Entry
- Selected indicator = RSI
- Value condition = Cross Limit 1
- Value limit 1 = 70.00000000
- Draw in chart = On
- Drawing slot = 1
Capturas de tela
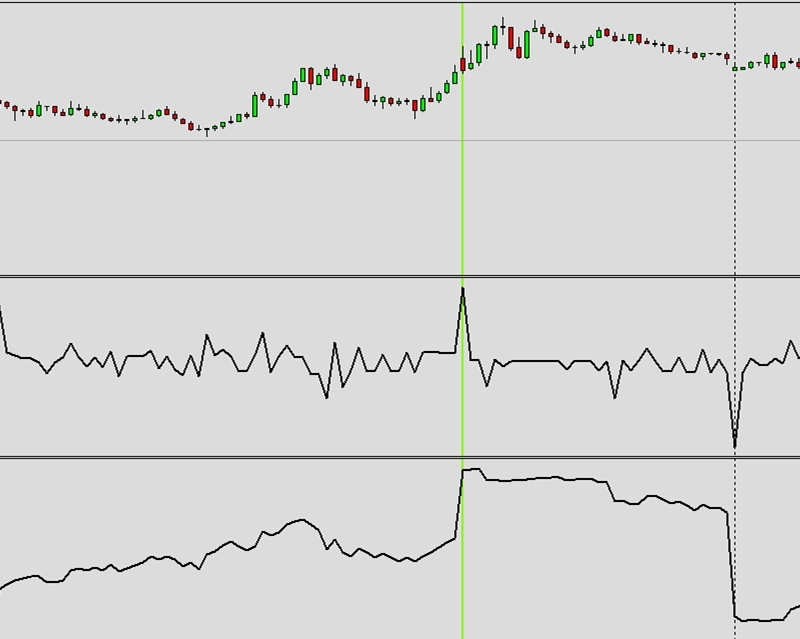
Exemplo J2: Duas linhas de oscilador combinadas como sinal
CAUTION
Esta não é uma estratégia de trading pronta para uso. Uma estratégia de trading requer ajuste do timeframe e do símbolo, além de backtesting rigoroso. O exemplo é destinado como base para sua própria estratégia personalizada e para ajudá-lo a se familiarizar com a aplicação web Expert Advisor Builder. Para importar e usar um exemplo, siga as instruções fornecidas aqui.
Descrição
Este exemplo combina os cruzamentos do histograma MACD para geração de sinais. Quando a linha principal do MACD cruza acima da linha de sinal, o momentum muda de negativo para positivo. Essa abordagem de cruzamento de zero identifica mudanças de momentum que frequentemente precedem movimentos de preço.
O MACD combina elementos de tendência e momentum, tornando-o versátil para várias condições de mercado. A visualização do histograma mostra a diferença entre as linhas, tornando os cruzamentos fáceis de identificar. Ambas as linhas são exibidas para compreensão completa da dinâmica do indicador.
Os osciladores de duas linhas fornecem sinais mais matizados do que as versões de uma linha. A relação entre as linhas revela a aceleração e desaceleração do momentum, oferecendo insights além das simples condições de sobrecompra/sobrevenda.
Reproduzir o exemplo
Você pode importar este exemplo diretamente ou configurá-lo manualmente. Para replicar manualmente o módulo de trading, certifique-se de que um módulo recém-adicionado inclua as seguintes configurações principais e que o modo profissional esteja ativado:
Trade Basics
- Operation type = Long signals only drawn
- General signal visualization = On
Signal Generation - Indicators (MACD Main line)
- Signal in use = On
- Signal used for = Entry
- Selected indicator = MACD
- Line index = Main line
- Draw in chart = On
- Drawing slot = 1
Signal Generation - Indicators (MACD Signal line)
- Signal in use = On
- Signal used for = Entry
- Selected indicator = MACD
- Line index = Signal line
- Draw in chart = On
- Drawing slot = 2
Signal Generation - Indicator Combinations (MACD Main line & MACD Signal line)
- Signal in use = On
- Signal used for = Entry
- Input indicator 1 = MACD (Main line)
- Input indicator 2 = MACD (Signal line)
- Value relation = Value 1 cross value 2
Capturas de tela
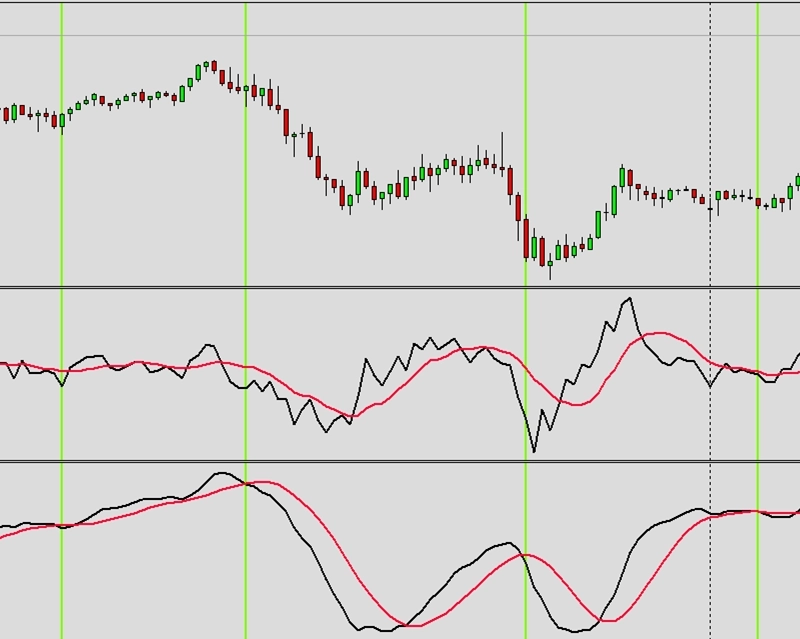
Exemplo J3: Usando volume como oscilador
CAUTION
Esta não é uma estratégia de trading pronta para uso. Uma estratégia de trading requer ajuste do timeframe e do símbolo, além de backtesting rigoroso. O exemplo é destinado como base para sua própria estratégia personalizada e para ajudá-lo a se familiarizar com a aplicação web Expert Advisor Builder. Para importar e usar um exemplo, siga as instruções fornecidas aqui.
Descrição
Este exemplo usa indicadores de volume para geração de sinais, exigindo dados de tick para cálculo preciso. O volume fornece insights de mercado únicos indisponíveis apenas pelo preço, revelando a convicção por trás dos movimentos de preço. Volume mais alto sugere comprometimento mais forte com novos níveis de preço.
O requisito de every-tick garante medição precisa de volume, embora isso exija mais poder de processamento. Os sinais baseados em volume frequentemente confirmam sinais baseados em preço, fornecendo validação adicional. A exibição do oscilador mostra os padrões de volume claramente para análise.
As estratégias de volume funcionam melhor em mercados líquidos onde os dados de volume são confiáveis. Este exemplo apresenta a integração de dados não-preço, expandindo as possibilidades de estratégia além da análise técnica pura.
CAUTION
Modelo Every tick necessário
Reproduzir o exemplo
Você pode importar este exemplo diretamente ou configurá-lo manualmente. Para replicar manualmente o módulo de trading, certifique-se de que um módulo recém-adicionado inclua as seguintes configurações principais e que o modo profissional esteja ativado:
Trade Basics
- Operation type = Long signals only drawn
- General signal visualization = On
Signal Generation - Indicators - VOLUME
- Signal in use = On
- Signal used for = Entry
- Selected indicator = VOLUME
- Series = Close
- Draw in chart = On
- Drawing slot = 1
Capturas de tela
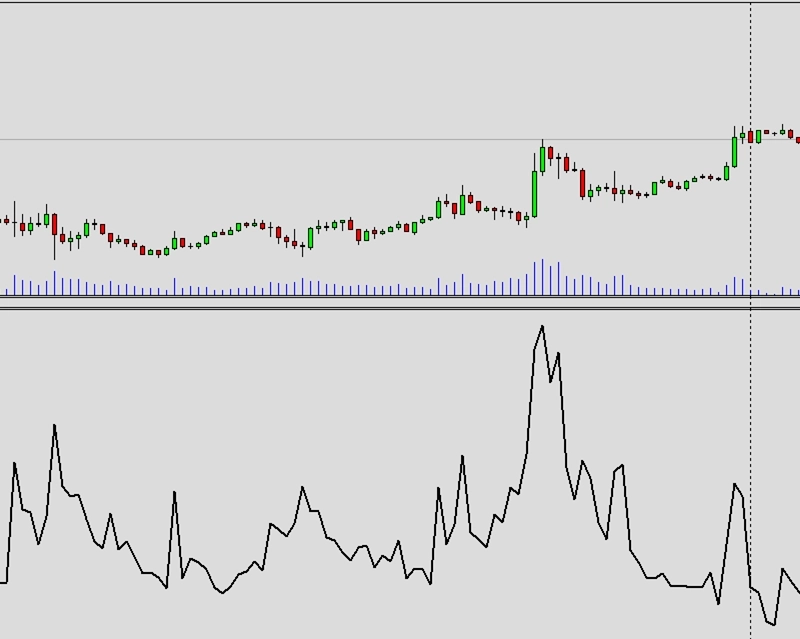
Exemplo K1: Múltiplas operações abertas permitidas
CAUTION
Esta não é uma estratégia de trading pronta para uso. Uma estratégia de trading requer ajuste do timeframe e do símbolo, além de backtesting rigoroso. O exemplo é destinado como base para sua própria estratégia personalizada e para ajudá-lo a se familiarizar com a aplicação web Expert Advisor Builder. Para importar e usar um exemplo, siga as instruções fornecidas aqui.
Descrição
Este exemplo permite múltiplas operações simultâneas do mesmo módulo, possibilitando o acúmulo de posição durante fortes tendências. Com o modo de uma operação desativado, cada sinal abre uma nova posição independentemente das operações existentes. Essa abordagem agressiva maximiza a exposição durante condições favoráveis.
Múltiplas posições amplificam tanto os lucros quanto os riscos, exigindo gestão de dinheiro cuidadosa. A exibição visual mostra todas as posições abertas claramente, ajudando os traders a monitorar a exposição total. O dimensionamento fixo de lotes evita o crescimento exponencial de posição que poderia se tornar incontrolável.
Essa configuração é adequada para mercados fortemente em tendência onde múltiplas entradas podem capturar movimentos estendidos. No entanto, os traders devem entender o maior risco de posições concentradas e ajustar o dimensionamento de posição adequadamente.
Reproduzir o exemplo
Você pode importar este exemplo diretamente ou configurá-lo manualmente. Para replicar manualmente o módulo de trading, certifique-se de que um módulo recém-adicionado inclua as seguintes configurações principais e que o modo profissional esteja ativado:
Trade Basics
- Operation type = Long
- One trade mode = Off
Signal Generation - Indicators - STD
- Signal in use = On
- Signal used for = Forward
- Selected indicator = STD
- Draw in chart = Off
- Forward adjustment = 3.50
Signal Generation - Indicators - SMA
- Signal in use = On
- Signal used for = Entry
- Selected indicator = SMA
- Draw in chart = On
- Drawing slot = 1
Signal Generation - Indicators - EMA
- Signal in use = On
- Signal used for = Entry
- Selected indicator = EMA
- Draw in chart = On
- Drawing slot = 2
Signal Generation - Indicator Combinations (SMA & EMA)
- Signal in use = On
- Signal used for = Entry
- Input indicator 1 = SMA
- Input indicator 2 = EMA
- Value relation = Value x cross value x
Initial Stop Loss
- Selection = Indicator
- Used indicator = STD
Initial Take Profit
- Selection = Risk ratio
- Risk ratio = 1.40
Capturas de tela
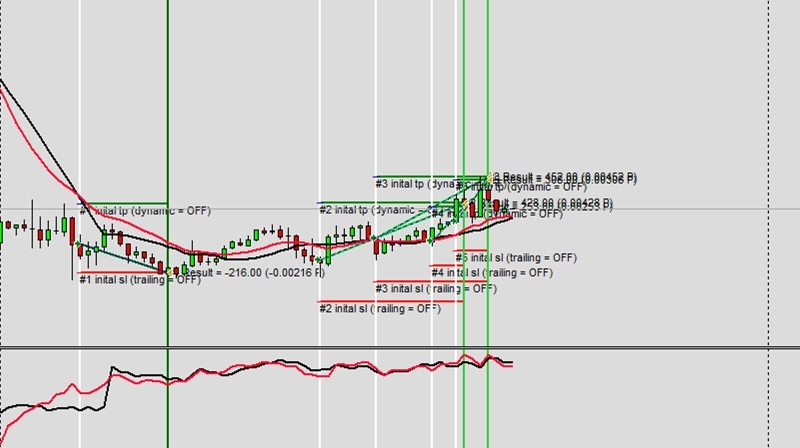
Exemplo K2: Sinais usados para abertura e fechamento de operações
CAUTION
Esta não é uma estratégia de trading pronta para uso. Uma estratégia de trading requer ajuste do timeframe e do símbolo, além de backtesting rigoroso. O exemplo é destinado como base para sua própria estratégia personalizada e para ajudá-lo a se familiarizar com a aplicação web Expert Advisor Builder. Para importar e usar um exemplo, siga as instruções fornecidas aqui.
Descrição
Este exemplo usa cruzamentos MACD tanto para sinais de entrada quanto de saída, criando um sistema de trading completo. Os cruzamentos opostos fecham as posições existentes, garantindo que as operações saiam quando o momentum reverte. Essa abordagem simétrica mantém lógica consistente para ambas as direções de operação.
As saídas baseadas em sinais diferem das saídas por Stop Loss/Take Profit ao responder às condições de mercado em vez de níveis fixos. Essa abordagem adaptativa pode capturar movimentos maiores em fortes tendências enquanto sai rapidamente quando as condições mudam. O sistema permanece totalmente automatizado sem intervenção manual.
Sistemas de sinal completos ensinam o gerenciamento completo do ciclo de vida de operações. Entender a lógica de sinal de entrada e saída cria estratégias mais coerentes do que misturar diferentes metodologias.
Reproduzir o exemplo
Você pode importar este exemplo diretamente ou configurá-lo manualmente. Para replicar manualmente o módulo de trading, certifique-se de que um módulo recém-adicionado inclua as seguintes configurações principais e que o modo profissional esteja ativado:
Trade Basics
- Operation type = Long
Signal Generation - Indicators (MACD Main line)
- Signal in use = On
- Signal used for = Entry
- Selected indicator = MACD
- Line index = Main line
- Draw in chart = On
- Drawing slot = 1
Signal Generation - Indicators (MACD Signal line)
- Signal in use = On
- Signal used for = Entry
- Selected indicator = MACD
- Line index = Signal line
- Draw in chart = On
- Drawing slot = 2
Signal Generation - Indicator Combinations (MACD Main line & MACD Signal line)
- Signal in use = On
- Signal used for = Entry
- Input indicator 1 = MACD (Main line)
- Input indicator 2 = MACD (Signal line)
- Value relation = Value 1 cross value 2
Signal Generation - Indicator Combinations (MACD Main line & MACD Signal line)
- Signal in use = On
- Signal used for = Exit
- Input indicator 1 = MACD (Main line)
- Input indicator 2 = MACD (Signal line)
- Value relation = Value 2 cross value 1
Capturas de tela
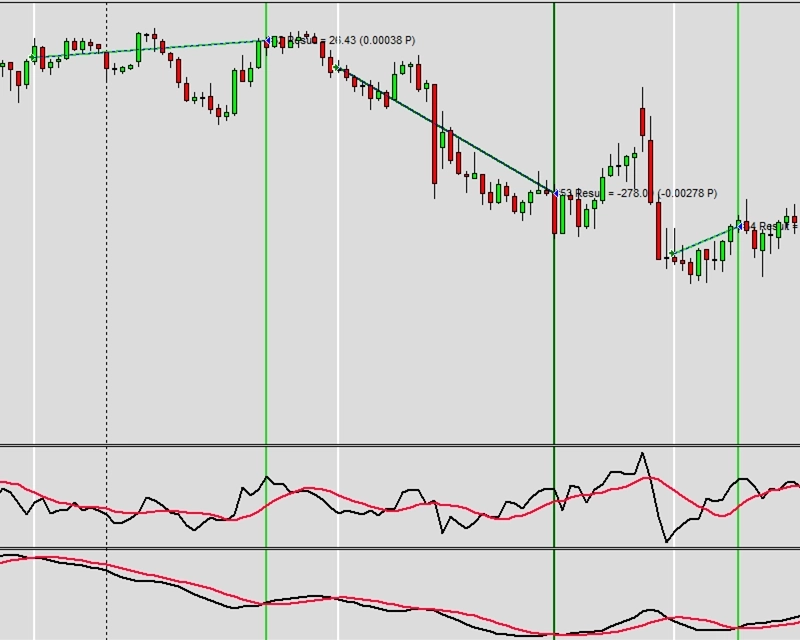
Exemplo K3: Combinação de sinais com lógica OU
CAUTION
Esta não é uma estratégia de trading pronta para uso. Uma estratégia de trading requer ajuste do timeframe e do símbolo, além de backtesting rigoroso. O exemplo é destinado como base para sua própria estratégia personalizada e para ajudá-lo a se familiarizar com a aplicação web Expert Advisor Builder. Para importar e usar um exemplo, siga as instruções fornecidas aqui.
Descrição
Este exemplo demonstra a lógica OU para combinação de sinais, onde qualquer sinal positivo aciona operações. As duas médias móveis operam de forma independente: qualquer cruzamento gera sinais válidos. Essa abordagem inclusiva aumenta a frequência de sinais em comparação com a lógica E que requer ambos.
A lógica OU é adequada para diversas condições de mercado ao permitir que diferentes indicadores capturem vários tipos de oportunidades. Os cruzamentos rápidos de SMA capturam movimentos rápidos enquanto os cruzamentos mais lentos de EMA identificam tendências maiores. Os sinais visuais mostram qual indicador acionou cada operação.
Os operadores lógicos mudam fundamentalmente o comportamento da estratégia. Entender a lógica OU versus E ajuda os traders a projetar sistemas que correspondam à sua filosofia de trading e tolerância ao risco.
Reproduzir o exemplo
Você pode importar este exemplo diretamente ou configurá-lo manualmente. Para replicar manualmente o módulo de trading, certifique-se de que um módulo recém-adicionado inclua as seguintes configurações principais e que o modo profissional esteja ativado:
Trade Basics
- Operation type = Long
- Signal logic = Logical OR
Signal Generation - Indicators - STD
- Signal in use = On
- Signal used for = Forward
- Selected indicator = STD
- Draw in chart = Off
- Forward adjustment = 3.50
Signal Generation - Indicators - SMA
- Signal in use = On
- Signal used for = Entry
- Selected indicator = SMA
- Period = 50
- Gradient condition = Cross Limit 1
- Gradient limit 1 = 0.00000000
- Draw in chart = On
- Drawing slot = 1
Signal Generation - Indicators - EMA
- Signal in use = On
- Signal used for = Entry
- Selected indicator = EMA
- Period = 100
- Gradient condition = Cross Limit 1
- Gradient limit 1 = 0.00000000
- Draw in chart = On
- Drawing slot = 2
Initial Stop Loss
- Selection = Indicator
- Used indicator = STD
Initial Take Profit
- Selection = Risk ratio
- Risk ratio = 1.40
Capturas de tela
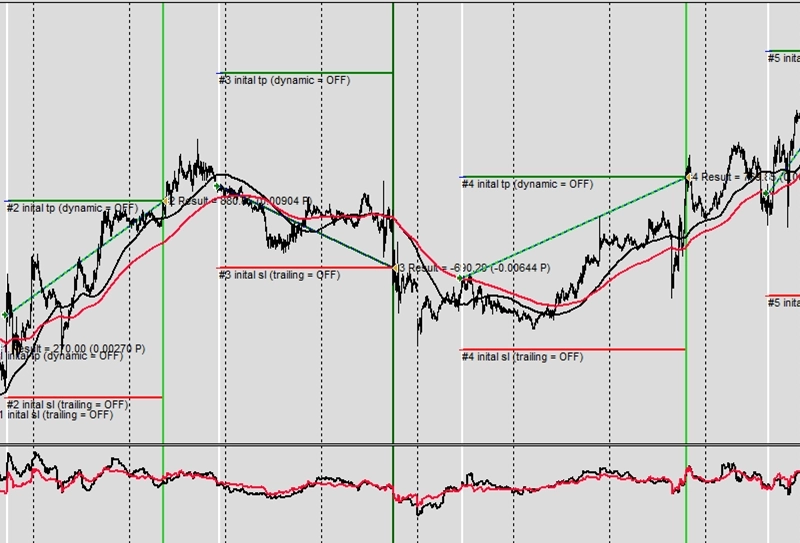
Exemplo K4: Tempo de espera forçado entre operações
CAUTION
Esta não é uma estratégia de trading pronta para uso. Uma estratégia de trading requer ajuste do timeframe e do símbolo, além de backtesting rigoroso. O exemplo é destinado como base para sua própria estratégia personalizada e para ajudá-lo a se familiarizar com a aplicação web Expert Advisor Builder. Para importar e usar um exemplo, siga as instruções fornecidas aqui.
Descrição
Este exemplo impõe períodos de espera de 50 barras entre as operações, evitando entradas sucessivas rápidas. Após o fechamento de cada operação, o sistema deve aguardar 50 barras antes de aceitar novos sinais. Esse período de resfriamento evita o excesso de trading e permite que as condições de mercado se desenvolvam.
A espera forçada reduz o trading emocional ao impor disciplina mecanicamente. Mesmo sinais perfeitos são ignorados durante os períodos de espera, mantendo espaçamento consistente de operações. Essa abordagem é adequada para estratégias que exigem desenvolvimento específico de mercado entre oportunidades.
O espaçamento de operações baseado em tempo difere do espaçamento baseado em sinais ao usar tempo absoluto em vez de condições de mercado. Isso cria frequência de operações previsível útil para cálculos de dimensionamento de posição e gestão de risco.
Reproduzir o exemplo
Você pode importar este exemplo diretamente ou configurá-lo manualmente. Para replicar manualmente o módulo de trading, certifique-se de que um módulo recém-adicionado inclua as seguintes configurações principais e que o modo profissional esteja ativado:
Trade Basics
- Operation type = Long
- One trade mode = Off
- Waiting time between trades = 50
Signal Generation - Indicators - STD
- Signal in use = On
- Signal used for = Forward
- Selected indicator = STD
- Draw in chart = Off
- Forward adjustment = 3.50
Signal Generation - Indicators - SMA
- Signal in use = On
- Signal used for = Entry
- Selected indicator = SMA
- Draw in chart = On
- Drawing slot = 1
Signal Generation - Indicators - EMA
- Signal in use = On
- Signal used for = Entry
- Selected indicator = EMA
- Draw in chart = On
- Drawing slot = 2
Signal Generation - Indicator Combinations (SMA & EMA)
- Signal in use = On
- Signal used for = Entry
- Input indicator 1 = SMA
- Input indicator 2 = EMA
- Value relation = Value x cross value x
Signal Generation - News
- Selection = Indicator
- Used indicator = STD
Signal Generation - News
- Selection = Risk ratio
- Risk ratio = 1.40
Capturas de tela
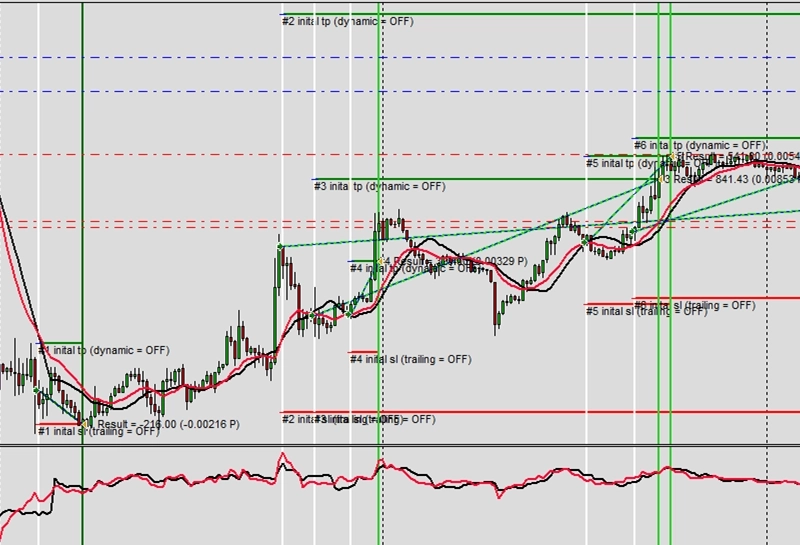
Exemplo L1: Apenas sinal MACD Long
CAUTION
Esta não é uma estratégia de trading pronta para uso. Uma estratégia de trading requer ajuste do timeframe e do símbolo, além de backtesting rigoroso. O exemplo é destinado como base para sua própria estratégia personalizada e para ajudá-lo a se familiarizar com a aplicação web Expert Advisor Builder. Para importar e usar um exemplo, siga as instruções fornecidas aqui.
Descrição
Este exemplo exibe sinais MACD long sem executar operações, útil para o desenvolvimento de estratégias e análise de sinais. Linhas verticais verdes marcam cada cruzamento MACD de alta, fornecendo confirmação visual da lógica do sinal. Esse modo de observação permite o refinamento da estratégia antes de arriscar capital.
O modo somente sinal ajuda os traders a entender quando e por que os sinais ocorrem sem comprometimento financeiro. Ao observar os sinais em diferentes condições de mercado, os traders podem avaliar a viabilidade da estratégia antes do trading ao vivo. Os marcadores visuais criam registros históricos claros para análise.
Essa abordagem educacional aproxima o trading manual do automatizado. Os traders podem observar sinais automatizados enquanto fazem operações discricionárias, combinando geração sistemática de sinais com julgamento humano.
Reproduzir o exemplo
Você pode importar este exemplo diretamente ou configurá-lo manualmente. Para replicar manualmente o módulo de trading, certifique-se de que um módulo recém-adicionado inclua as seguintes configurações principais e que o modo profissional esteja ativado:
Trade Basics
- Operation type = Long signals only drawn
- General signal visualization = On
Signal Generation - Indicators (MACD Main line)
- Signal in use = On
- Signal used for = Entry
- Selected indicator = MACD
- Line index = Main line
- Draw in chart = On
- Drawing slot = 1
Signal Generation - Indicators (MACD Signal line)
- Signal in use = On
- Signal used for = Entry
- Selected indicator = MACD
- Line index = Signal line
- Draw in chart = On
- Drawing slot = 2
Signal Generation - Indicator Combinations (MACD Main line & MACD Signal line)
- Signal in use = On
- Signal used for = Entry
- Input indicator 1 = MACD (Main line)
- Input indicator 2 = MACD (Signal line)
- Value relation = Value 1 cross value 2
Capturas de tela
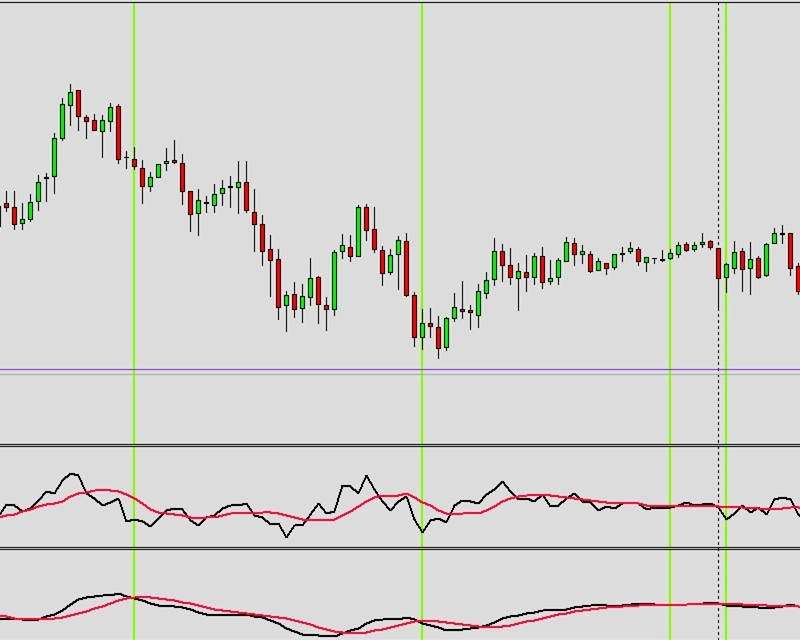
Exemplo L2: Apenas sinal MACD Short
CAUTION
Esta não é uma estratégia de trading pronta para uso. Uma estratégia de trading requer ajuste do timeframe e do símbolo, além de backtesting rigoroso. O exemplo é destinado como base para sua própria estratégia personalizada e para ajudá-lo a se familiarizar com a aplicação web Expert Advisor Builder. Para importar e usar um exemplo, siga as instruções fornecidas aqui.
Descrição
Este exemplo visualiza sinais MACD short usando linhas verticais vermelhas sem executar operações. Os cruzamentos de baixa são claramente marcados, mostrando quando o momentum descendente começa. Essa visualização ajuda os traders a entender a frequência e o timing dos sinais short.
A visualização de sinais short frequentemente revela padrões diferentes dos sinais long no mesmo mercado. Muitos ativos têm vieses direcionais que afetam a distribuição dos sinais. Observar ambas as direções ajuda os traders a escolher direções de trading ideais para instrumentos específicos.
As linhas de sinal vermelhas criam forte contraste visual, tornando os sinais de baixa imediatamente aparentes. Essa visualização clara auxilia no reconhecimento de padrões e na avaliação de estratégias durante períodos de backtesting ou forward testing.
Reproduzir o exemplo
Você pode importar este exemplo diretamente ou configurá-lo manualmente. Para replicar manualmente o módulo de trading, certifique-se de que um módulo recém-adicionado inclua as seguintes configurações principais e que o modo profissional esteja ativado:
Trade Basics
- Operation type = Short signals only drawn
- General signal visualization = On
Signal Generation - Indicators (MACD Main line)
- Signal in use = On
- Signal used for = Entry
- Selected indicator = MACD
- Line index = Main line
- Draw in chart = On
- Drawing slot = 1
Signal Generation - Indicators (MACD Signal line)
- Signal in use = On
- Signal used for = Entry
- Selected indicator = MACD
- Line index = Signal line
- Draw in chart = On
- Drawing slot = 2
Signal Generation - Indicator Combinations (MACD Main line & MACD Signal line)
- Signal in use = On
- Signal used for = Entry
- Input indicator 1 = MACD (Main line)
- Input indicator 2 = MACD (Signal line)
- Value relation = Value 2 cross value 1
Capturas de tela
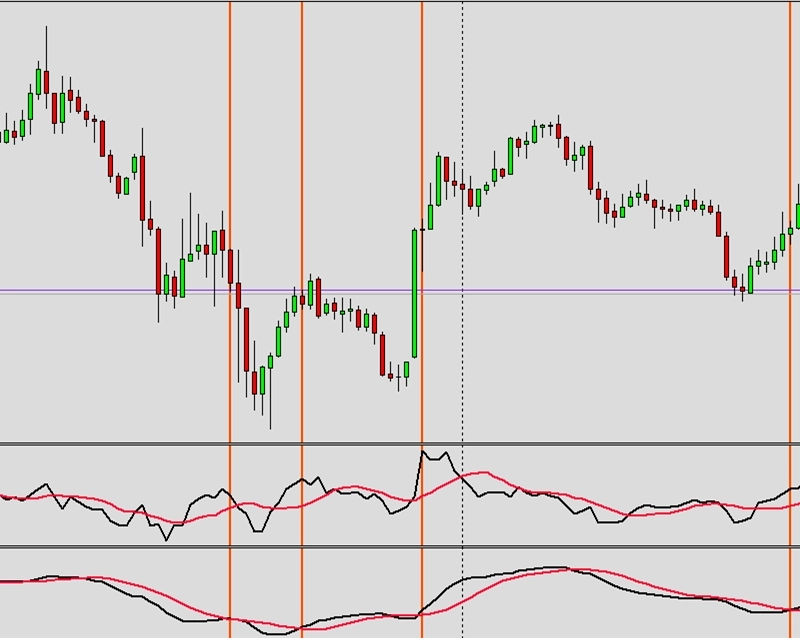
Exemplo M1: Valor de indicador para cálculo de volume com indicador externo
CAUTION
Esta não é uma estratégia de trading pronta para uso. Uma estratégia de trading requer ajuste do timeframe e do símbolo, além de backtesting rigoroso. O exemplo é destinado como base para sua própria estratégia personalizada e para ajudá-lo a se familiarizar com a aplicação web Expert Advisor Builder. Para importar e usar um exemplo, siga as instruções fornecidas aqui.
Descrição
Este exemplo integra cálculos de volume externos por meio de indicadores personalizados, demonstrando capacidades avançadas de integração. O indicador externo MyExternalVolume fornece cálculos de volume além das opções padrão. Essa flexibilidade permite algoritmos proprietários enquanto usa gestão de risco externa.
Os indicadores personalizados devem ser instalados corretamente na pasta de indicadores do MetaTrader com os caminhos corretos especificados. O sistema encaminha os valores calculados para o dimensionamento de posição, criando gestão dinâmica de volume com base em lógica personalizada. Isso aproxima métodos proprietários à execução sistemática.
A integração externa permite sofisticação ilimitada de estratégia. Os traders podem implementar modelos matemáticos complexos, saídas de machine learning ou cálculos proprietários enquanto aproveitam as capacidades de gestão de operações do framework.
CAUTION
Para executar este exemplo, você precisará de um indicador externo. Basta baixar, compilar e usar os arquivos listados abaixo.
Código de indicador MQL 4: MyExternalVolume.mq4
Código de indicador MQL 5: MyExternalVolume.mq5
Reproduzir o exemplo
Você pode importar este exemplo diretamente ou configurá-lo manualmente. Para replicar manualmente o módulo de trading, certifique-se de que um módulo recém-adicionado inclua as seguintes configurações principais e que o modo profissional esteja ativado:
Trade Basics
- Operation type = Long
Signal Generation - Indicators - STD
- Signal in use = On
- Signal used for = Forward
- Selected indicator = STD
- Draw in chart = Off
- Forward adjustment = 3.50
Signal Generation - Indicators (MACD Main line)
- Signal in use = On
- Signal used for = Entry
- Selected indicator = MACD
- Line index = Main line
- Draw in chart = On
- Drawing slot = 1
Signal Generation - Indicators (MACD Signal line)
- Signal in use = On
- Signal used for = Entry
- Selected indicator = MACD
- Line index = Signal line
- Draw in chart = On
- Drawing slot = 2
Signal Generation - CUS - Custom oscillator
- Signal in use = On
- Signal used for = Forward
- Selected indicator = CUS - Custom oscillator
- MetaTrader4 path to indicator file = \FEA Trading\MT4\MyExternalVolume.ex4
- MetaTrader5 path to indicator file = FEA Trading\MT5\MyExternalVolume
- Draw in chart = On
- Drawing slot = 3
Signal Generation - Indicator Combinations (MACD Main line & MACD Signal line)
- Signal in use = On
- Signal used for = Entry
- Input indicator 1 = MACD (Main line)
- Input indicator 2 = MACD (Signal line)
- Value relation = Value 1 cross value 2
Signal Generation - News
- Selection = Indicator
- Used indicator = STD
Signal Generation - News
- Selection = Risk ratio
- Risk ratio = 1.40
Signal Generation - News
- Volume calculation method = Indicator value
- Used indicator = CUS
Capturas de tela
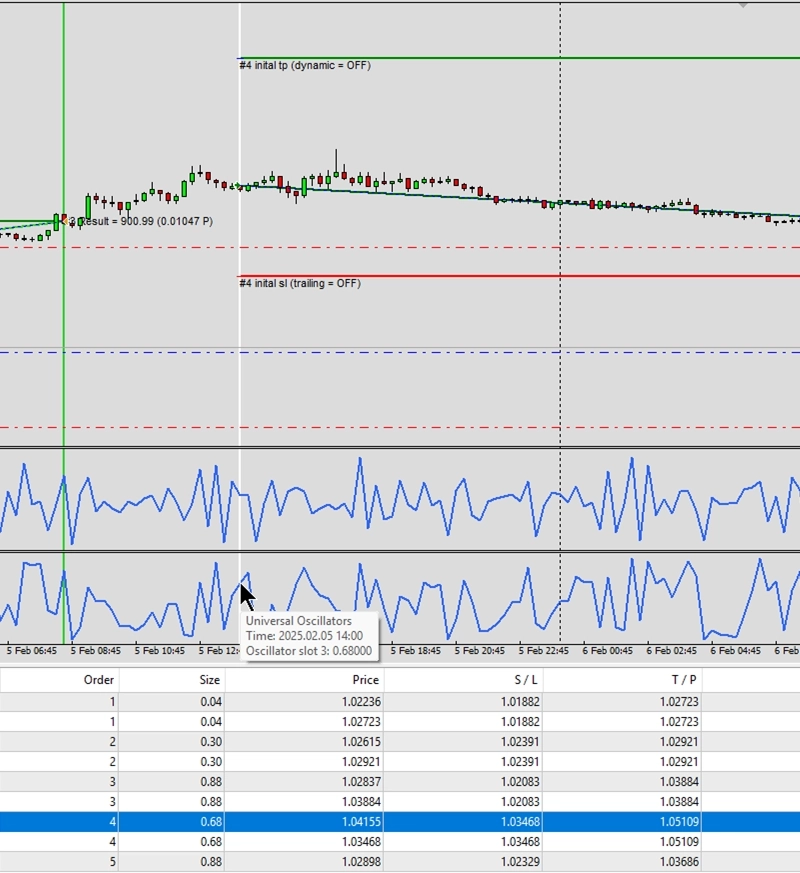
Exemplo N1: Sinais não operados gerados por busca de velas
CAUTION
Esta não é uma estratégia de trading pronta para uso. Uma estratégia de trading requer ajuste do timeframe e do símbolo, além de backtesting rigoroso. O exemplo é destinado como base para sua própria estratégia personalizada e para ajudá-lo a se familiarizar com a aplicação web Expert Advisor Builder. Para importar e usar um exemplo, siga as instruções fornecidas aqui.
Descrição
Este exemplo demonstra como o motor de busca de padrões de velas funciona sem executar operações reais. O módulo é configurado para detectar várias formações de candlestick e exibi-las como sinais no gráfico. Ele monitora 24 formações de velas diferentes, incluindo Hammer, variações de Doji, padrões Engulfing e Morning/Evening Stars. Quando qualquer um desses padrões aparece, o módulo gera um sinal visual, mas não abre posições.
O componente Data Feedback é definido para analisar padrões detectados em 10.000 períodos, criando estatísticas valiosas sobre a frequência e distribuição dos padrões. Essas informações ajudam os traders a entender quais padrões ocorrem com mais frequência em seus mercados escolhidos. O recurso de histograma com 100 bins fornece análise detalhada das ocorrências de padrões.
Essa configuração é perfeita para traders que desejam estudar padrões de candlestick antes de implementá-los em estratégias de trading ao vivo. Ao observar como os padrões se formam e sua frequência, você pode tomar decisões informadas sobre quais padrões incluir em seus sistemas de trading automatizados.
Reproduzir o exemplo
Você pode importar este exemplo diretamente ou configurá-lo manualmente. Para replicar manualmente o módulo de trading, certifique-se de que um módulo recém-adicionado inclua as seguintes configurações principais e que o modo profissional esteja ativado:
Trade Basics
- Operation type = Long signals only drawn
- General signal visualization = On
Signal Generation - Candle Patterns
- Signal in use = On
- Signal used for = Entry
- Hammer = On
- Hanging Man = On
- Bullish Belt Hold = On
- Bearish Belt Hold = On
- Bullish Engulfing = On
- Bearish Engulfing = On
- Bullish Harami = On
- Bearish Harami = On
- Bullish Harami Cross = On
- Bearish Harami Cross = On
- Bullish Doji = On
- Bearish Doji = On
- Bullish Long Legged Doji = On
- Bearish Long Legged Doji = On
- Bullish Gravestone Doji = On
- Bearish Gravestone Doji = On
- Bullish Dragonfly Doji = On
- Bearish Dragonfly Doji = On
- Dark Cloud Cover = On
- Piercing Pattern = On
- Morning Star = On
- Evening Star = On
- Bullish Inside Days = On
- Bearish Inside Days = On
- Signal visualization = Off
Data Feedback
- Value analysis = On
- Value analysis refresh interval = 1000
- Value analysis news period = 0
- Value analysis indicator period = 0
- Value analysis chart analyzer period = 0
- Value analysis Candle pattern search period = 10000
- Value analysis Chart pattern search period = 0
- Value analysis Fibonacci pattern search period = 0
- Value analysis histogram bins = 100
Capturas de tela
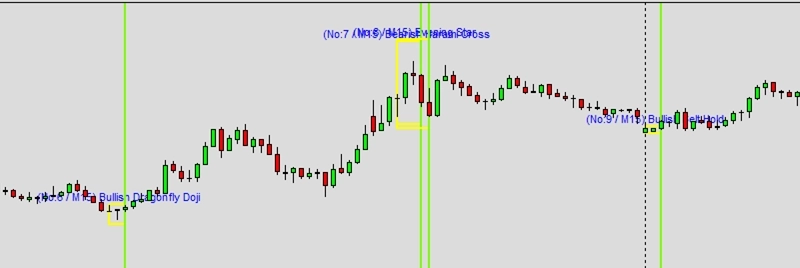
Exemplo N2: Sinais não operados gerados por busca de padrões
CAUTION
Esta não é uma estratégia de trading pronta para uso. Uma estratégia de trading requer ajuste do timeframe e do símbolo, além de backtesting rigoroso. O exemplo é destinado como base para sua própria estratégia personalizada e para ajudá-lo a se familiarizar com a aplicação web Expert Advisor Builder. Para importar e usar um exemplo, siga as instruções fornecidas aqui.
Descrição
Este exemplo apresenta o motor de busca de padrões de gráficos operando no modo somente sinal. O módulo identifica formações de gráficos complexas sem colocar operações, tornando-o ideal para treinamento em reconhecimento de padrões e desenvolvimento de estratégias. Ele detecta 18 padrões de gráficos diferentes, incluindo Cunhas, Triângulos, formações de Ombro-Cabeça-Ombro, Topos/Fundos Duplos e Triplos e Retângulos.
O sistema verifica continuamente os movimentos de preço para identificar esses padrões clássicos de análise técnica. Quando detectados, sinais visuais aparecem no gráfico, ajudando você a entender a formação de padrões em tempo real. A seção Data Feedback coleta dados de ocorrência de padrões em 10.000 períodos, fornecendo estatísticas abrangentes sobre frequência e confiabilidade dos padrões.
Essa configuração é particularmente útil para traders que aprendem a reconhecer padrões de gráficos ou validam estratégias baseadas em padrões. Os recursos de visualização ajudam a ver exatamente quando e onde os padrões se formam, enquanto a análise estatística revela quais padrões aparecem com mais frequência nos mercados selecionados. Esse conhecimento forma a base para desenvolver estratégias de trading baseadas em padrões lucrativas.
Reproduzir o exemplo
Você pode importar este exemplo diretamente ou configurá-lo manualmente. Para replicar manualmente o módulo de trading, certifique-se de que um módulo recém-adicionado inclua as seguintes configurações principais e que o modo profissional esteja ativado:
Trade Basics
- Operation type = Long signals only drawn
- General signal visualization = On
Signal Generation - Chart Patterns
- Signal in use = On
- Signal used for = Entry
- Bullish Wedge = On
- Bearish Wedge = On
- Bullish Trendchannel = On
- Bearish Trendchannel = On
- Bullish Triangle = On
- Bearish Triangle = On
- Shoulder Head Shoulder Top = On
- Shoulder Head Shoulder Bottom = On
- Double Top = On
- Double Bottom = On
- Triple Top = On
- Triple Bottom = On
- Rectangle Top = On
- Rectangle Bottom = On
- Bullish Symetric Triangle = On
- Bearish Symetric Triangle = On
- Bullish Gap = On
- Bearish Gap = On
- Signal visualization = Off
Data Feedback
- Value analysis = On
- Value analysis refresh interval = 1000
- Value analysis news period = 0
- Value analysis indicator period = 0
- Value analysis chart analyzer period = 0
- Value analysis Candle pattern search period = 0
- Value analysis Chart pattern search period = 10000
- Value analysis Fibonacci pattern search period = 0
- Value analysis histogram bins = 100
Capturas de tela
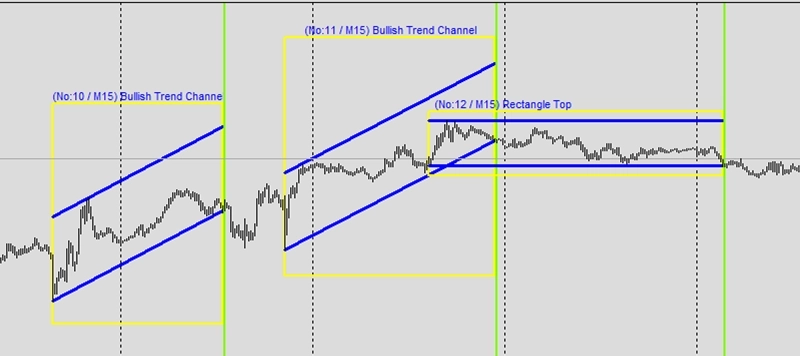
Exemplo N3: Sinais não operados gerados por busca de Fibonacci
CAUTION
Esta não é uma estratégia de trading pronta para uso. Uma estratégia de trading requer ajuste do timeframe e do símbolo, além de backtesting rigoroso. O exemplo é destinado como base para sua própria estratégia personalizada e para ajudá-lo a se familiarizar com a aplicação web Expert Advisor Builder. Para importar e usar um exemplo, siga as instruções fornecidas aqui.
Descrição
Este exemplo ilustra o motor de busca de padrões de Fibonacci funcionando no modo de observação. O módulo identifica padrões de retração e extensão de Fibonacci sem executar operações, permitindo que os traders estudem essas relações matemáticas nos movimentos de preço. Ele se concentra na detecção de padrões de Fibonacci de alta e de baixa com base nos níveis da razão áurea.
O motor de busca analisa os swings de preço e identifica automaticamente quando os preços respeitam os níveis-chave de Fibonacci como 38,2%, 50% e 61,8%. Esses níveis frequentemente agem como zonas de suporte e resistência onde ocorrem reversões de preço. O componente Data Feedback rastreia as ocorrências de padrões de Fibonacci em 10.000 períodos, construindo um banco de dados abrangente do comportamento dos padrões.
Essa configuração ajuda os traders a entender como a matemática de Fibonacci se aplica aos movimentos do mercado. Ao observar esses padrões sem risco de trading, você pode avaliar sua eficácia nos mercados escolhidos. A análise de histograma com 100 bins fornece insights detalhados sobre a distribuição dos padrões, ajudando a determinar as configurações ideais para incorporar padrões de Fibonacci em estratégias de trading automatizadas.
Reproduzir o exemplo
Você pode importar este exemplo diretamente ou configurá-lo manualmente. Para replicar manualmente o módulo de trading, certifique-se de que um módulo recém-adicionado inclua as seguintes configurações principais e que o modo profissional esteja ativado:
Trade Basics
- Operation type = Long signals only drawn
- General signal visualization = On
Signal Generation - Fibonacci Patterns
- Signal in use = On
- Signal used for = Entry
- Bullish Fibonacci = On
- Bearish Fibonacci = On
- Signal visualization = Off
Data Feedback
- Value analysis = On
- Value analysis refresh interval = 1000
- Value analysis news period = 0
- Value analysis indicator period = 0
- Value analysis chart analyzer period = 0
- Value analysis Candle pattern search period = 0
- Value analysis Chart pattern search period = 0
- Value analysis Fibonacci pattern search period = 10000
- Value analysis histogram bins = 100
Capturas de tela
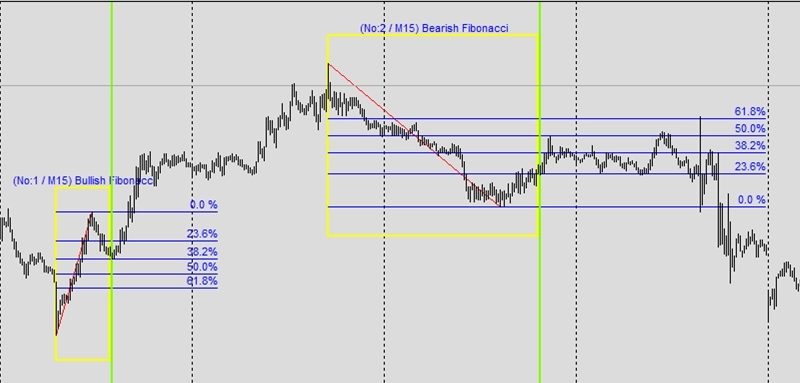
Exemplo O1: Análise estendida de swings
CAUTION
Esta não é uma estratégia de trading pronta para uso. Uma estratégia de trading requer ajuste do timeframe e do símbolo, além de backtesting rigoroso. O exemplo é destinado como base para sua própria estratégia personalizada e para ajudá-lo a se familiarizar com a aplicação web Expert Advisor Builder. Para importar e usar um exemplo, siga as instruções fornecidas aqui.
Descrição
Este exemplo demonstra a análise estendida de swings para detecção de padrões usando o analisador de gráficos. Ao examinar o swing anterior com parâmetros específicos de altura e largura, o sistema identifica formações complexas invisíveis para indicadores simples. O intervalo de altura de 160 a 180 visa swings de proporções específicas.
A análise estendida de swings imita a leitura humana de gráficos ao reconhecer padrões visuais. As características de cada swing são avaliadas em relação a critérios definidos, permitindo a detecção de topos duplos, triângulos e outras formações. A exibição visual mostra os swings e padrões detectados claramente.
Essa abordagem sofisticada aproxima a análise manual da automatizada. O sistema identifica padrões de forma consistente enquanto mantém o reconhecimento matizado que torna a análise humana valiosa.
Reproduzir o exemplo
Você pode importar este exemplo diretamente ou configurá-lo manualmente. Para replicar manualmente o módulo de trading, certifique-se de que um módulo recém-adicionado inclua as seguintes configurações principais e que o modo profissional esteja ativado:
Trade Basics
- Operation type = Long signals only drawn
- General signal visualization = On
Signal Generation - Chart Analyzer
- Signal in use = On
- Signal used for = Entry
- Signal visualization = Off
- Analyzed width = 50
- Draw boundaries = On
- Draw extrema = On
- Draw supports and resistances = On
- Draw swing phase = On
Signal Generation - Chart Analyzer - Swing configuration 1
- Swing number = 1
- Height minimum = 160
- Height maximum = 180
- Width minimum = 0
- Width maximum = 10000
Capturas de tela
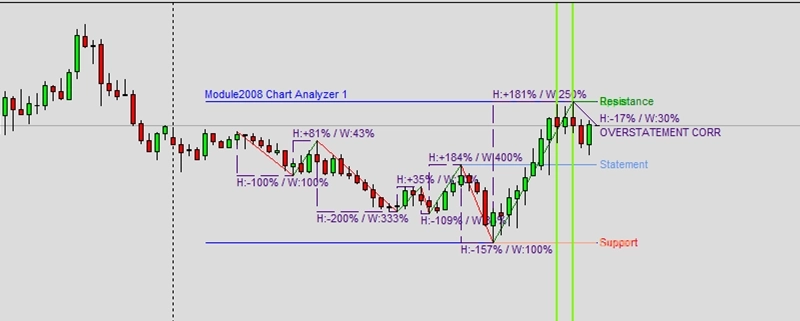
Exemplo O2: Desenho do painel do analisador de gráficos
CAUTION
Esta não é uma estratégia de trading pronta para uso. Uma estratégia de trading requer ajuste do timeframe e do símbolo, além de backtesting rigoroso. O exemplo é destinado como base para sua própria estratégia personalizada e para ajudá-lo a se familiarizar com a aplicação web Expert Advisor Builder. Para importar e usar um exemplo, siga as instruções fornecidas aqui.
Descrição
Este exemplo exibe o painel do analisador de gráficos mostrando análise de mercado abrangente em tempo real. Os níveis de suporte e resistência são identificados e exibidos automaticamente, fornecendo conscientização constante da estrutura do mercado. O painel é atualizado continuamente.
O painel do analisador consolida vários tipos de análise em uma única exibição, mostrando volatilidade, fase de swing e níveis-chave simultaneamente. Essa visão abrangente ajuda os traders a entender o contexto atual do mercado de relance. A detecção automática de níveis elimina o viés subjetivo na identificação de preços importantes.
O feedback visual aprimora a compreensão da estratégia ao mostrar exatamente o que o sistema vê. Essa transparência gera confiança nas decisões automatizadas enquanto educa os traders sobre os princípios de estrutura de mercado.
Reproduzir o exemplo
Você pode importar este exemplo diretamente ou configurá-lo manualmente. Para replicar manualmente o módulo de trading, certifique-se de que um módulo recém-adicionado inclua as seguintes configurações principais e que o modo profissional esteja ativado:
Trade Basics
- Operation type = Long
Signal Generation - Indicators (MACD Main line)
- Signal in use = On
- Signal used for = Entry
- Selected indicator = MACD
- Line index = Main line
- Draw in chart = On
- Drawing slot = 1
Signal Generation - Indicators (MACD Signal line)
- Signal in use = On
- Signal used for = Entry
- Selected indicator = MACD
- Line index = Signal line
- Draw in chart = On
- Drawing slot = 2
Signal Generation - Indicator Combinations (MACD Main line & MACD Signal line)
- Signal in use = On
- Signal used for = Entry
- Input indicator 1 = MACD (Main line)
- Input indicator 2 = MACD (Signal line)
- Value relation = Value x cross value x
Signal Generation - Chart Analyzer
- Signal in use = On
- Signal used for = Forward
- Draw boundaries = Off
- Draw extrema = Off
- Draw supports and resistances = On
- Draw swing phase = Off
- Supports and resistances forward = ALL
- Support multiplier = 1.00
- Resistance multiplier = 1.00
Initial Stop Loss
- Selection = Support/resistance from chart analyzer
- Used chart analyzer = Chart Analyzer
- Minimum value in fix pips = Off
- Minimum value in rate of change = 0.00250000
- Maximum value in fix pips = Off
- Maximum value in rate of change = Off
Initial Take Profit
- Selection = Support/resistance from chart analyzer
- Used chart analyzer = Chart Analyzer
- Minimum value in fix pips = Off
- Minimum value in rate of change = 0.00300000
- Maximum value in fix pips = Off
- Maximum value in rate of change = Off
Miscellaneous
- Draw chart analyzer panel = On
Capturas de tela
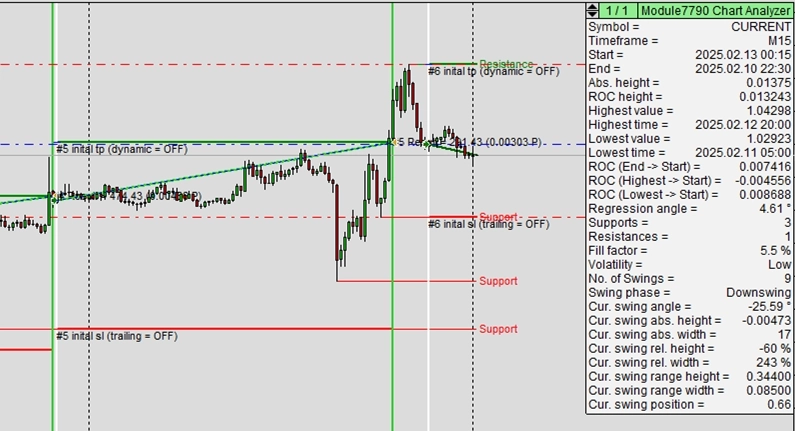
Exemplo O3: Exclusão de suporte e resistência no encaminhamento
CAUTION
Esta não é uma estratégia de trading pronta para uso. Uma estratégia de trading requer ajuste do timeframe e do símbolo, além de backtesting rigoroso. O exemplo é destinado como base para sua própria estratégia personalizada e para ajudá-lo a se familiarizar com a aplicação web Expert Advisor Builder. Para importar e usar um exemplo, siga as instruções fornecidas aqui.
Descrição
Este exemplo exclui certos níveis de suporte e resistência do encaminhamento usando a configuração ex. -2;+2. Apenas os segundos níveis mais próximos de suporte e resistência são encaminhados para cálculos de Stop Loss e Take Profit. Esse encaminhamento seletivo evita o uso de níveis muito próximos ou muito longe do preço atual.
O encaminhamento seletivo de níveis melhora o posicionamento das saídas ao filtrar níveis inadequados. Os níveis mais próximos podem estar muito próximos para uma gestão de risco adequada, enquanto os níveis distantes podem ser irrealistas.
A exibição visual mostra todos os níveis detectados enquanto destaca quais estão sendo encaminhados ativamente. Essa transparência ajuda os traders a entender como o sistema seleciona os níveis de saída entre as opções disponíveis.
Reproduzir o exemplo
Você pode importar este exemplo diretamente ou configurá-lo manualmente. Para replicar manualmente o módulo de trading, certifique-se de que um módulo recém-adicionado inclua as seguintes configurações principais e que o modo profissional esteja ativado:
Trade Basics
- Operation type = Long
Signal Generation - Indicators (MACD Main line)
- Signal in use = On
- Signal used for = Entry
- Selected indicator = MACD
- Line index = Main line
- Draw in chart = On
- Drawing slot = 1
Signal Generation - Indicators (MACD Signal line)
- Signal in use = On
- Signal used for = Entry
- Selected indicator = MACD
- Line index = Signal line
- Draw in chart = On
- Drawing slot = 2
Signal Generation - Indicator Combinations (MACD Main line & MACD Signal line)
- Signal in use = On
- Signal used for = Entry
- Input indicator 1 = MACD (Main line)
- Input indicator 2 = MACD (Signal line)
- Value relation = Value x cross value x
Signal Generation - Chart Analyzer
- Signal in use = On
- Signal used for = Forward
- Draw boundaries = Off
- Draw extrema = Off
- Draw supports and resistances = On
- Draw swing phase = Off
- Supports and resistances forward = -2;+2
- Support multiplier = 1.00
- Resistance multiplier = 1.00
Initial Stop Loss
- Selection = Support/resistance from chart analyzer
- Used chart analyzer = Chart Analyzer
- Minimum value in fix pips = Off
- Minimum value in rate of change = 0.00250000
- Maximum value in fix pips = Off
- Maximum value in rate of change = Off
Initial Take Profit
- Selection = Support/resistance from chart analyzer
- Used chart analyzer = Chart Analyzer
- Minimum value in fix pips = Off
- Minimum value in rate of change = 0.00300000
- Maximum value in fix pips = Off
- Maximum value in rate of change = Off
Capturas de tela
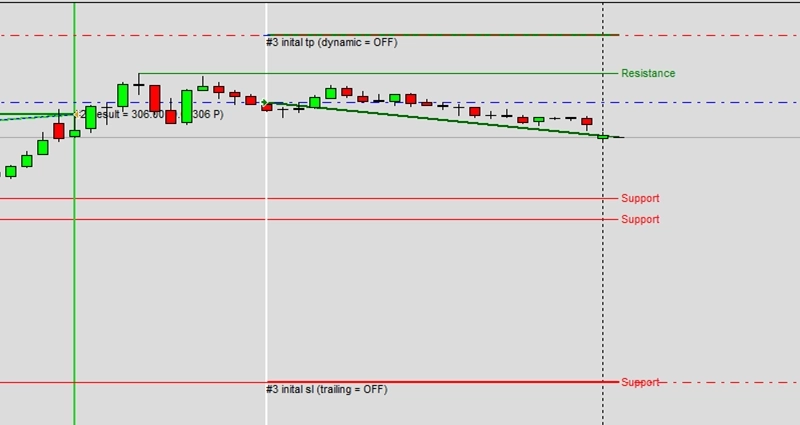
Exemplo O4: Dois analisadores de gráficos para geração de sinais
CAUTION
Esta não é uma estratégia de trading pronta para uso. Uma estratégia de trading requer ajuste do timeframe e do símbolo, além de backtesting rigoroso. O exemplo é destinado como base para sua própria estratégia personalizada e para ajudá-lo a se familiarizar com a aplicação web Expert Advisor Builder. Para importar e usar um exemplo, siga as instruções fornecidas aqui.
Descrição
Este exemplo emprega dois analisadores de gráficos com parâmetros diferentes para geração abrangente de sinais. O analisador de 50 barras detecta volatilidade de curto prazo enquanto o analisador de 200 barras identifica fases de mercado de longo prazo. A combinação de ambos fornece análise de múltiplos timeframes dentro de um único timeframe.
Diferentes larguras de analisador capturam diferentes características de mercado. Os analisadores curtos respondem rapidamente a mudanças recentes enquanto os analisadores longos identificam condições persistentes. A combinação requer acordo de ambas as perspectivas, filtrando os sinais de forma eficaz.
As estratégias de analisador duplo demonstram como múltiplas janelas de análise podem trabalhar juntas. Essa abordagem se aplica a qualquer indicador ou método de análise onde diferentes períodos de lookback fornecem insights complementares.
Reproduzir o exemplo
Você pode importar este exemplo diretamente ou configurá-lo manualmente. Para replicar manualmente o módulo de trading, certifique-se de que um módulo recém-adicionado inclua as seguintes configurações principais e que o modo profissional esteja ativado:
Trade Basics
- Operation type = Long signals only drawn
- General signal visualization = On
Signal Generation - Chart Analyzer 1
- Signal in use = On
- Signal used for = Entry
- Analyzed width = 50
- Draw boundaries = On
- Draw extrema = On
- Draw supports and resistances = On
- Draw swing phase = On
- Signal if volatility is low = Off
- Signal if volatility is middle = Off
- Signal if volatility is high = On
Signal Generation - Chart Analyzer 2
- Signal in use = On
- Signal used for = Entry
- Analyzed width = 200
- Draw boundaries = On
- Draw extrema = On
- Draw supports and resistances = On
- Draw swing phase = On
- Signal if swing phase is overstatement = Off
- Signal if swing phase is understatement = On
- Signal if swing phase is over correction = Off
- Signal if swing phase is under correction = On
- Signal if swing phase is upswing = Off
- Signal if swing phase is downswing = Off
- Signal if swing phase is undefined = Off
- Breakout factor = 1.00
Capturas de tela
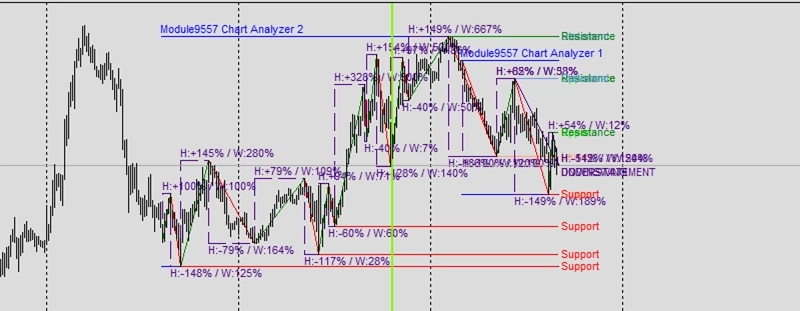
Exemplo P1: Todos os recursos de feedback ativados
CAUTION
Esta não é uma estratégia de trading pronta para uso. Uma estratégia de trading requer ajuste do timeframe e do símbolo, além de backtesting rigoroso. O exemplo é destinado como base para sua própria estratégia personalizada e para ajudá-lo a se familiarizar com a aplicação web Expert Advisor Builder. Para importar e usar um exemplo, siga as instruções fornecidas aqui.
Descrição
Este exemplo ativa todos os recursos de feedback de dados para análise abrangente de estratégia. Cada aspecto da atividade de trading é registrado, desde dados de tick até métricas de desempenho. O inspetor monitora continuamente a saúde da estratégia enquanto logs detalhados rastreiam todos os eventos.
O feedback abrangente permite análise profunda e otimização de estratégias. Ao registrar tudo, os traders podem identificar padrões, problemas e oportunidades invisíveis durante o trading ao vivo. Os dados de símbolo de múltiplos timeframes fornecem contexto para as decisões de operação.
Essa abordagem rica em dados é adequada para o desenvolvimento sério de estratégias onde cada detalhe importa. As informações coletadas permitem validação de backtesting, análise de desempenho e melhoria sistemática baseada em evidências empíricas.
Reproduzir o exemplo
Você pode importar este exemplo diretamente ou configurá-lo manualmente. Para replicar manualmente o módulo de trading, certifique-se de que um módulo recém-adicionado inclua as seguintes configurações principais e que o modo profissional esteja ativado:
Trade Basics
- Operation type = Long
Signal Generation - Indicators - STD
- Signal in use = On
- Signal used for = Forward
- Selected indicator = STD
- Draw in chart = Off
- Forward adjustment = 3.50
Signal Generation - Indicators - RSI
- Signal in use = On
- Signal used for = Entry
- Selected indicator = RSI
- Gradient condition = Cross Limit 1
- Gradient limit 1 = 0.00000000
- Draw in chart = On
- Drawing slot = 1
Initial Stop Loss
- Selection = Indicator
- Used indicator = STD
Initial Take Profit
- Selection = Risk ratio
- Risk ratio = 1.40
Data Feedback
- Inspector = On
- Present trades = On
- Past trades = On
- Meta data = On
- Trade screenshots = Off
- Current value = On
- Current value news = On
- Current value indicator = On
- Current value chart analyzer = On
- Current value Candle pattern search = On
- Current value Chart pattern search = On
- Current value Fibonacci pattern search = On
- Time analysis = On
- Value analysis = On
- Signal analysis = On
- Symbol series bars current = On
- Symbol series bars completed = On
- Symbol series M1 = On
- Symbol series M5 = On
- Symbol series M15 = On
- Symbol series M30 = On
- Symbol series H1 = On
- Symbol series H4 = On
- Symbol series D1 = On
- Symbol series W1 = On
- Symbol series MN = On
Capturas de tela
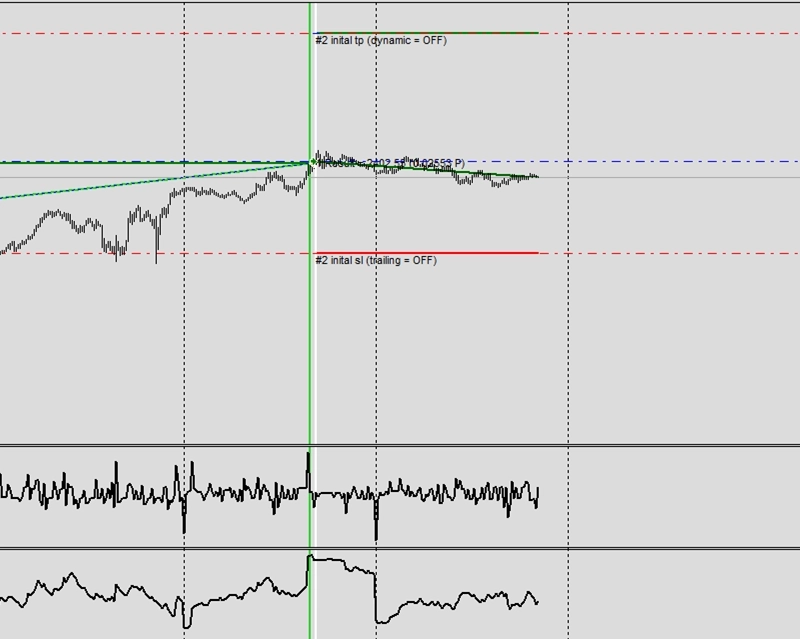
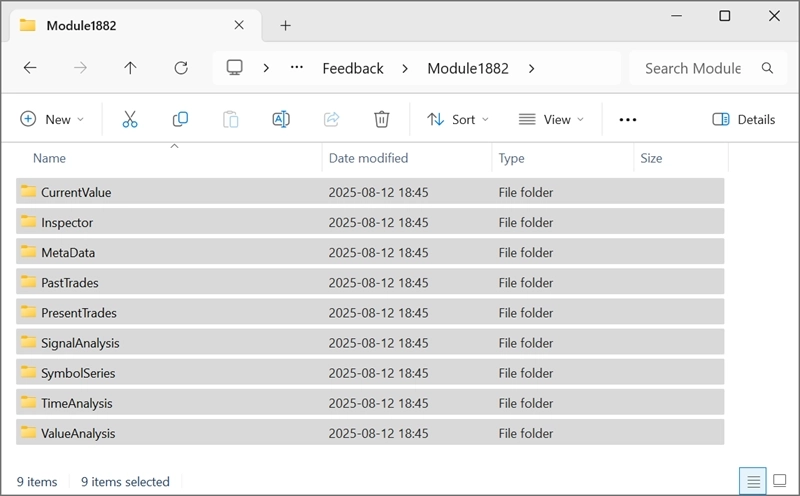
Exemplo Q1: Mapeamento de símbolos para símbolos personalizados
CAUTION
Esta não é uma estratégia de trading pronta para uso. Uma estratégia de trading requer ajuste do timeframe e do símbolo, além de backtesting rigoroso. O exemplo é destinado como base para sua própria estratégia personalizada e para ajudá-lo a se familiarizar com a aplicação web Expert Advisor Builder. Para importar e usar um exemplo, siga as instruções fornecidas aqui.
Descrição
Este exemplo demonstra o mapeamento de nomes de símbolos para compatibilidade multi-corretora. As referências ao USDCHF na estratégia são automaticamente substituídas por EURUSD durante a execução. Isso permite usar a mesma estratégia em corretoras com diferentes convenções de nomenclatura de símbolos.
O mapeamento de símbolos resolve problemas práticos ao trocar de corretoras ou usar símbolos personalizados. As estratégias permanecem portáteis sem edição manual para o esquema de nomenclatura de cada corretora. As três configurações de mapeamento mostram diferentes aplicações ao vivo versus teste.
Essa flexibilidade permite estratégias sofisticadas de múltiplos símbolos que se adaptam aos instrumentos disponíveis. Os traders podem desenvolver estratégias em símbolos personalizados e depois implantá-las em símbolos padrão sem modificação.
CAUTION
Recomendado usar EURUSD M15, M1 executado em ambos os símbolos necessário.
Reproduzir o exemplo
Você pode importar este exemplo diretamente ou configurá-lo manualmente. Para replicar manualmente o módulo de trading, certifique-se de que um módulo recém-adicionado inclua as seguintes configurações principais e que o modo profissional esteja ativado:
Trade Basics
- Operation type = Long signals only drawn
- General signal visualization = Off
Signal Generation - Indicators 1 - RSI
- Signal in use = On
- Signal used for = Entry
- Selected indicator = RSI
- Symbol = Current
- Shift = 1
- Draw in chart = On
- Drawing slot = 1
Signal Generation - Indicators 2 - RSI
- Signal in use = On
- Signal used for = Entry
- Selected indicator = RSI
- Symbol = USDCHF
- Shift = 0
- Draw in chart = On
- Drawing slot = 2
Symbol and Timeframe
- Symbol = Current
- Timeframe = Current
Symbol and Timeframe - Symbol name mapping 1
- Used in live trading = On
- Used in strategy testing = Off
- String to replace = USDCHF
- String it is replaced with = EURUSD
Symbol and Timeframe - Symbol name mapping 2
- Used in live trading = On
- Used in strategy testing = On
- String to replace = USDCHF
- String it is replaced with = EURUSD
Symbol and Timeframe - Symbol name mapping 3
- Used in live trading = Off
- Used in strategy testing = On
- String to replace = USDCHF
- String it is replaced with = EURUSD
Capturas de tela
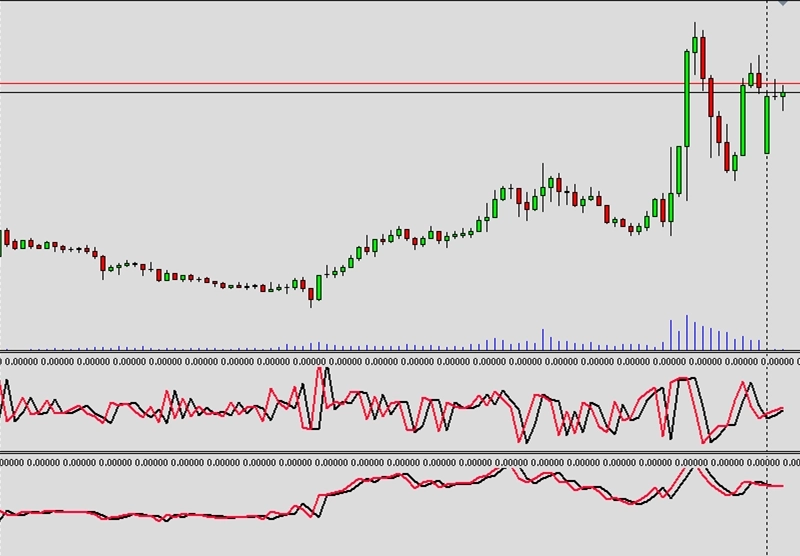
Exemplo Q2: Uso de múltiplos símbolos e feedback de símbolo (EURUSD e USDCHF)
CAUTION
Esta não é uma estratégia de trading pronta para uso. Uma estratégia de trading requer ajuste do timeframe e do símbolo, além de backtesting rigoroso. O exemplo é destinado como base para sua própria estratégia personalizada e para ajudá-lo a se familiarizar com a aplicação web Expert Advisor Builder. Para importar e usar um exemplo, siga as instruções fornecidas aqui.
Descrição
Este exemplo usa múltiplos símbolos simultaneamente com feedback abrangente mostrando dados do EURUSD e do USDCHF. A correlação entre os símbolos é visível como oscilador, ajudando a entender as relações entre mercados. Ambos os símbolos devem ter dados M1 disponíveis para operação adequada.
As estratégias de múltiplos símbolos capturam relações entre instrumentos correlacionados. Ao monitorar múltiplos símbolos, o sistema pode identificar divergências e confirmações entre mercados. A exibição de séries de símbolos mostra o alinhamento da ação de preço entre mercados.
Essa abordagem permite trading de pares, hedging e estratégias baseadas em correlação. Entender como diferentes símbolos interagem fornece insights indisponíveis na análise de símbolo único.
CAUTION
Recomendado usar EURUSD M15, M1 executado em ambos os símbolos necessário.
Reproduzir o exemplo
Você pode importar este exemplo diretamente ou configurá-lo manualmente. Para replicar manualmente o módulo de trading, certifique-se de que um módulo recém-adicionado inclua as seguintes configurações principais e que o modo profissional esteja ativado:
Trade Basics
- Operation type = Long signals only drawn
- General signal visualization = Off
Signal Generation - Indicators 1 - RSI
- Signal in use = On
- Signal used for = Entry
- Selected indicator = RSI
- Symbol = Current
- Draw in chart = On
- Drawing slot = 1
Signal Generation - Indicators 2 - RSI
- Signal in use = On
- Signal used for = Entry
- Selected indicator = RSI
- Symbol = USDCHF
- Draw in chart = On
- Drawing slot = 2
Data Feedback
- Inspector = On
- Symbol series bars current = On
- Symbol series bars completed = On
- Symbol series M1 = Off
- Symbol series M5 = Off
- Symbol series M15 = On
- Symbol series M15 range = 100
- Symbol series M30 = Off
- Symbol series H1 = Off
- Symbol series H4 = Off
- Symbol series D1 = Off
- Symbol series W1 = Off
- Symbol series MN = Off
Capturas de tela
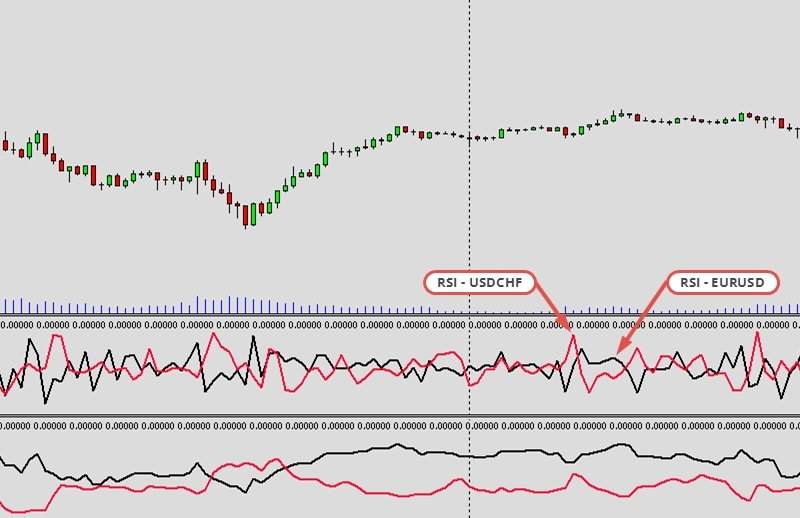
Exemplo Q3: Coeficiente de correlação entre dois símbolos (EURUSD e USDCHF)
CAUTION
Esta não é uma estratégia de trading pronta para uso. Uma estratégia de trading requer ajuste do timeframe e do símbolo, além de backtesting rigoroso. O exemplo é destinado como base para sua própria estratégia personalizada e para ajudá-lo a se familiarizar com a aplicação web Expert Advisor Builder. Para importar e usar um exemplo, siga as instruções fornecidas aqui.
Descrição
Este exemplo calcula coeficientes de correlação entre EURUSD e USDCHF ao longo de 50 períodos. O indicador de correlação quantifica a força da relação entre os símbolos, gerando sinais com base nas mudanças de correlação. Essa abordagem matemática remove a interpretação subjetiva das relações entre mercados.
Os valores de correlação variam de -1 a +1, com valores negativos indicando relações inversas. EURUSD e USDCHF normalmente mostram correlação negativa devido à posição oposta do USD em cada par. Operar as mudanças de correlação pode identificar quebras de relação que oferecem oportunidades.
A exibição visual de correlação ajuda os traders a entender as relações dinâmicas entre mercados. Essa abordagem quantitativa fornece medição objetiva de conceitos subjetivos como “correlação” ou “divergência”.
CAUTION
Recomendado usar EURUSD M15, M1 executado em ambos os símbolos necessário.
Reproduzir o exemplo
Você pode importar este exemplo diretamente ou configurá-lo manualmente. Para replicar manualmente o módulo de trading, certifique-se de que um módulo recém-adicionado inclua as seguintes configurações principais e que o modo profissional esteja ativado:
Trade Basics
- Operation type = Long signals only drawn
- General signal visualization = Off
Signal Generation - Indicators - COR
- Signal in use = On
- Signal used for = Entry
- Selected indicator = COR
- Period = 50
- Symbol for comparison = USDCHF
- Symbol = Current
- Draw in chart = On
- Drawing slot = 1
Capturas de tela
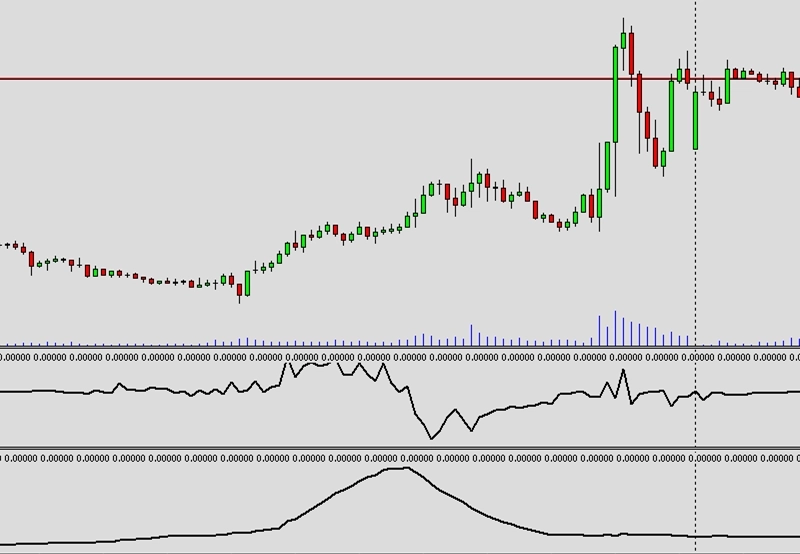
Exemplo R1: Sinal de oscilador personalizado e script Python externo
CAUTION
Esta não é uma estratégia de trading pronta para uso. Uma estratégia de trading requer ajuste do timeframe e do símbolo, além de backtesting rigoroso. O exemplo é destinado como base para sua própria estratégia personalizada e para ajudá-lo a se familiarizar com a aplicação web Expert Advisor Builder. Para importar e usar um exemplo, siga as instruções fornecidas aqui.
Descrição
Este exemplo integra scripts Python externos para geração sofisticada de sinais. O script MyExternalOscillatorGenerator.py realiza cálculos, enviando resultados para o indicador personalizado. Isso permite machine learning, análise estatística ou qualquer estratégia baseada em Python.
A integração Python abre possibilidades ilimitadas para o desenvolvimento de estratégias. Ferramentas modernas de ciência de dados, conexões de API e algoritmos complexos ficam disponíveis enquanto se mantêm as capacidades de execução do MetaTrader. A exibição visual mostra os sinais gerados pelo Python claramente.
Essa integração avançada aproxima a programação moderna das plataformas de trading tradicionais. Os traders podem aproveitar o vasto ecossistema do Python enquanto se beneficiam do acesso ao mercado e da infraestrutura de execução do MetaTrader.
CAUTION
Este exemplo requer um oscilador externo e um script Python adicional. Baixe, compile e use os arquivos listados abaixo. Certifique-se de que os caminhos estejam corretamente configurados e que o script Python esteja em execução durante a execução.
Código de indicador MQL 4: MyExternalOscillator.mq4
Código de indicador MQL 5: MyExternalOscillator.mq5
Script Python de exemplo: MyExternalOscillatorGenerator.py
Reproduzir o exemplo
Você pode importar este exemplo diretamente ou configurá-lo manualmente. Para replicar manualmente o módulo de trading, certifique-se de que um módulo recém-adicionado inclua as seguintes configurações principais e que o modo profissional esteja ativado:
Trade Basics
- Operation type = Long signals only drawn
- General signal visualization = Off
Signal Generation - CUS - Custom oscillator
- Signal in use = On
- Signal used for = Entry
- Selected indicator = CUS - Custom oscillator
- MetaTrader4 path to indicator file = \FEA Trading\MT4\MyExternalOscillator.ex4
- MetaTrader5 path to indicator file = FEA Trading\MT5\MyExternalOscillator
- Draw in chart = On
- Drawing slot = 1
Capturas de tela
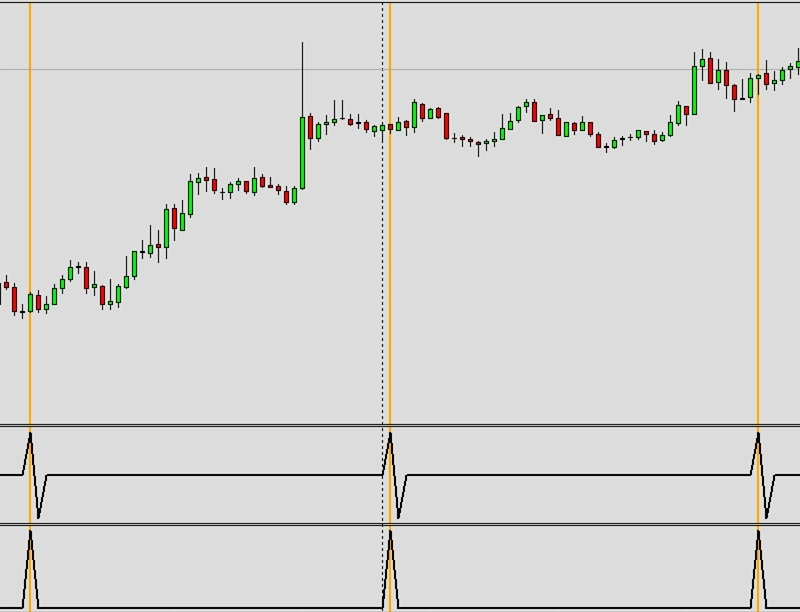
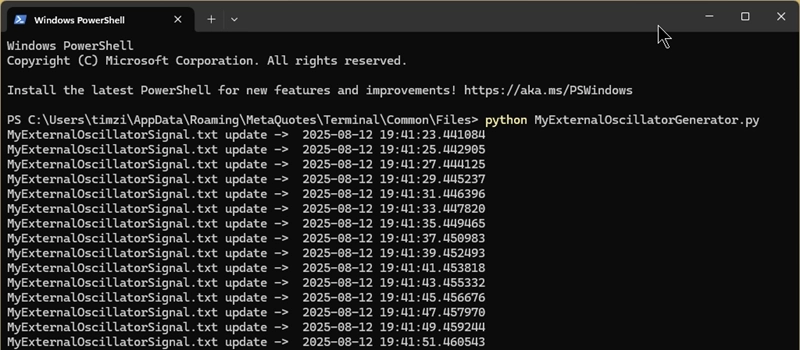
Exemplo R2: Encaminhamento de parâmetros e análise de feedback com indicador personalizado e script Python externo
CAUTION
Esta não é uma estratégia de trading pronta para uso. Uma estratégia de trading requer ajuste do timeframe e do símbolo, além de backtesting rigoroso. O exemplo é destinado como base para sua própria estratégia personalizada e para ajudá-lo a se familiarizar com a aplicação web Expert Advisor Builder. Para importar e usar um exemplo, siga as instruções fornecidas aqui.
Descrição
Este exemplo demonstra o encaminhamento de parâmetros entre o MetaTrader e Python com análise de feedback. Três parâmetros são enviados ao script Python que os processa e retorna os valores calculados. O sistema de feedback exibe tanto os parâmetros enviados quanto os resultados recebidos para transparência completa.
A comunicação bidirecional permite ajuste dinâmico de estratégia com base em cálculos externos. Os scripts Python podem acessar bancos de dados, serviços web ou modelos complexos, retornando parâmetros otimizados para trading. A série de símbolos de 100 barras fornece contexto de mercado para processamento externo.
Essa integração sofisticada representa o futuro do trading algorítmico onde múltiplos sistemas colaboram. Os indicadores tradicionais se combinam com o processamento moderno de dados para o desenvolvimento superior de estratégias.
CAUTION
Este exemplo requer um indicador externo e um script Python adicional. Baixe, compile e use os arquivos listados abaixo. Certifique-se de que os caminhos estejam corretamente configurados e que o script Python esteja em execução durante a execução.
Código de indicador MQL 4: MyExternalIndicator.mq4
Código de indicador MQL 5: MyExternalIndicator.mq5
Script Python de exemplo: MyExternalIndicatorGenerator.py
Reproduzir o exemplo
Você pode importar este exemplo diretamente ou configurá-lo manualmente. Para replicar manualmente o módulo de trading, certifique-se de que um módulo recém-adicionado inclua as seguintes configurações principais e que o modo profissional esteja ativado:
Trade Basics
- Operation type = Long signals only drawn
- General signal visualization = Off
Signal Generation - CUS - Custom indicator
- Signal in use = On
- Signal used for = Entry
- Selected indicator = CUS - Custom indicator
- Custom parameter 1 = 1.00000000
- Custom parameter 2 = 2.00000000
- Custom parameter 3 = 3.00000000
- MetaTrader4 path to indicator file = \FEA Trading\MT4\MyExternalIndicator.ex4
- MetaTrader5 path to indicator file = FEA Trading\MT5\MyExternalIndicator
- Draw in chart = On
- Drawing slot = 1
Data Feedback
- Symbol series bars current = On
- Symbol series bars completed = On
- Symbol series M1 = Off
- Symbol series M5 = Off
- Symbol series M15 = On
- Symbol series M15 range = 100
- Symbol series M30 = Off
- Symbol series H1 = Off
- Symbol series H4 = Off
- Symbol series D1 = Off
- Symbol series W1 = Off
- Symbol series MN = Off
Capturas de tela
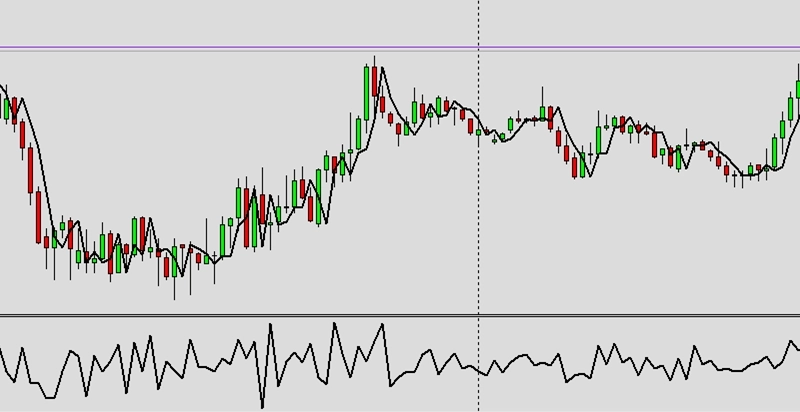
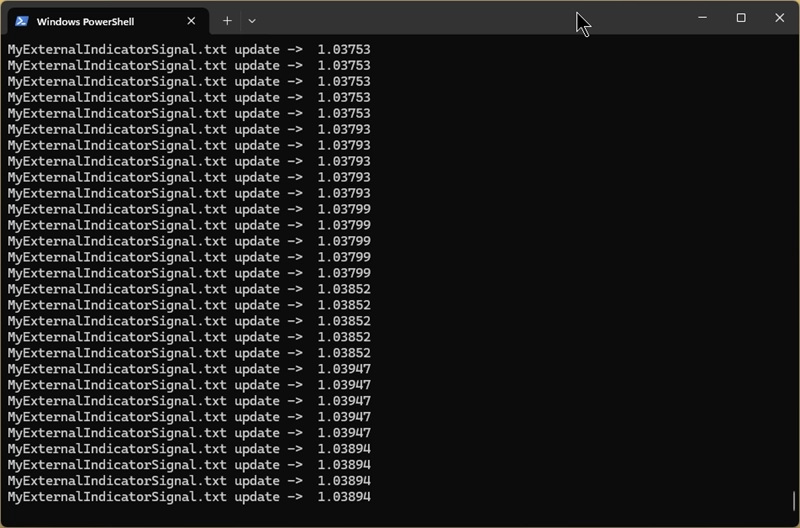
Exemplo S1: Desenho de segundo timeframe no gráfico
CAUTION
Esta não é uma estratégia de trading pronta para uso. Uma estratégia de trading requer ajuste do timeframe e do símbolo, além de backtesting rigoroso. O exemplo é destinado como base para sua própria estratégia personalizada e para ajudá-lo a se familiarizar com a aplicação web Expert Advisor Builder. Para importar e usar um exemplo, siga as instruções fornecidas aqui.
Descrição
Este exemplo sobrepõe velas H4 em timeframes mais rápidos para análise de múltiplos timeframes. A exibição de segundo timeframe mostra o contexto de tendência maior enquanto se opera em timeframes menores. Isso evita operar contra as principais tendências invisíveis nos gráficos rápidos.
A sobreposição de timeframe superior fornece contexto instantâneo sem trocar de gráficos. Os traders veem tanto o timing detalhado de entrada quanto a direção geral da tendência simultaneamente. A representação visual torna o alinhamento de múltiplos timeframes imediatamente aparente.
Essa técnica de exibição ensina conceitos importantes de múltiplos timeframes. Entender como diferentes timeframes se relacionam ajuda os traders a evitar erros comuns como operar contra a tendência com base apenas em sinais de curto prazo.
CAUTION
Recomendado usar timeframe menor que H4
Reproduzir o exemplo
Você pode importar este exemplo diretamente ou configurá-lo manualmente. Para replicar manualmente o módulo de trading, certifique-se de que um módulo recém-adicionado inclua as seguintes configurações principais e que o modo profissional esteja ativado:
Trade Basics
- Operation type = Long
Signal Generation - Indicators - STD
- Signal in use = On
- Signal used for = Forward
- Selected indicator = STD
- Draw in chart = Off
- Forward adjustment = 3.50
Signal Generation - Indicators - SMA
- Signal in use = On
- Signal used for = Entry
- Selected indicator = SMA
- Draw in chart = On
- Drawing slot = 1
Signal Generation - Indicators - EMA
- Signal in use = On
- Signal used for = Entry
- Selected indicator = EMA
- Draw in chart = On
- Drawing slot = 2
Signal Generation - Indicator Combinations (SMA & EMA)
- Signal in use = On
- Signal used for = Entry
- Input indicator 1 = SMA
- Input indicator 2 = EMA
- Value relation = Value x cross value x
Initial Stop Loss
- Selection = Indicator
- Used indicator = STD
Initial Take Profit
- Selection = Risk ratio
- Risk ratio = 1.40
Miscellaneous
- Draw second timeframe = H4
Capturas de tela
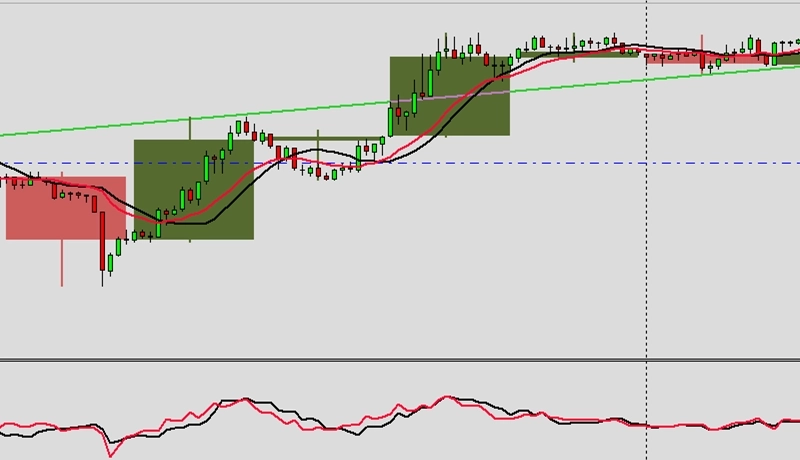
Exemplo S2: Desenho de símbolos distintos
CAUTION
Esta não é uma estratégia de trading pronta para uso. Uma estratégia de trading requer ajuste do timeframe e do símbolo, além de backtesting rigoroso. O exemplo é destinado como base para sua própria estratégia personalizada e para ajudá-lo a se familiarizar com a aplicação web Expert Advisor Builder. Para importar e usar um exemplo, siga as instruções fornecidas aqui.
Descrição
Este exemplo exibe símbolos distintos no mesmo gráfico quando os indicadores usam símbolos diferentes. Tanto o EURUSD quanto o USDCHF aparecem juntos, mostrando visualmente sua relação inversa. Essa exibição única ajuda a entender como as estratégias de múltiplos símbolos operam.
A exibição de símbolos distintos revela padrões de correlação e divergência imediatamente. Quando símbolos que normalmente se movem inversamente começam a se mover juntos, oportunidades significativas podem existir. A sobreposição visual elimina a troca constante de gráficos para monitoramento de múltiplos símbolos.
Essa visualização avançada é adequada para estratégias sofisticadas que usam múltiplos instrumentos. Ver todos os símbolos relevantes simultaneamente melhora a tomada de decisão e o reconhecimento de padrões entre mercados.
CAUTION
Recomendado usar EURUSD M15, M1 executado em ambos os símbolos necessário.
Reproduzir o exemplo
Você pode importar este exemplo diretamente ou configurá-lo manualmente. Para replicar manualmente o módulo de trading, certifique-se de que um módulo recém-adicionado inclua as seguintes configurações principais e que o modo profissional esteja ativado:
Trade Basics
- Operation type = Long signals only drawn
- General signal visualization = Off
Signal Generation - Indicators 1 - RSI
- Signal in use = On
- Signal used for = Entry
- Selected indicator = RSI
- Symbol = Current
- Draw in chart = On
- Drawing slot = 1
Signal Generation - Indicators 2 - RSI
- Signal in use = On
- Signal used for = Entry
- Selected indicator = RSI
- Symbol = USDCHF
- Draw in chart = On
- Drawing slot = 2
Miscellaneous
- Draw unequal symbols = On
Capturas de tela